
Wedding Cost by State 2026: How Many Months of Income a Wedding Takes
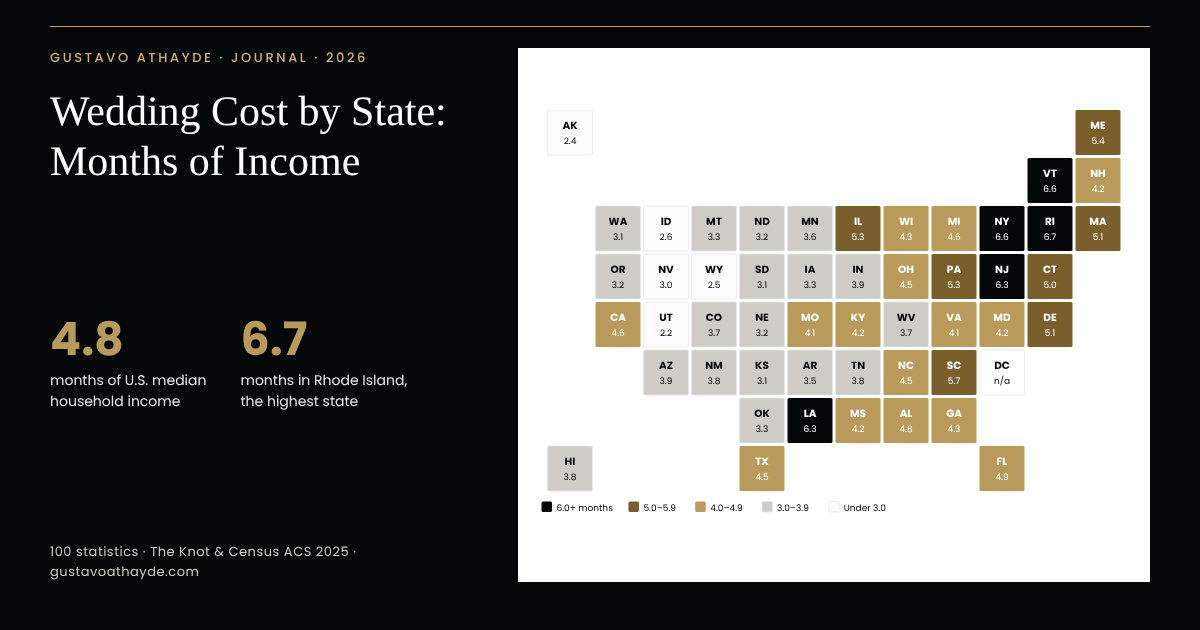
An American wedding is one of the largest celebrations a family will ever host, and its cost reads very differently from one state to the next. Our wedding cost by state index sets The Knot’s 2025 average for each state against the Census Bureau’s newest median household income, released in October 2026, to ask a simple question: how many months of income does a wedding take?
Nationally, the answer is 4.8 months. In Rhode Island it is 6.7 months; in Utah, 2.2. The finding that surprises most is that the costliest state is not the hardest one: New Jersey spends the most on weddings, but its high incomes place it fourth, while Louisiana, at exactly the national average cost, ranks fifth.
At a glance
Key takeaways
- The average 2025 wedding cost $34,000, or 4.8 months of U.S. median household income; the median wedding, $24,000, took 3.4 months.
- Rhode Island (6.7 months), New York (6.6) and Vermont (6.6) top the months-of-income ranking.
- New Jersey has the costliest weddings ($57,000) but ranks fourth, because it also has the highest median income of any state.
- Utah is the most attainable state: an $18,000 average equals 2.2 months of income. Alaska, Wyoming, Idaho and Nevada also come in under three months.
- Eight of the nine Northeastern states require five months or more; the average Western state requires 3.2.
- After inflation, the average wedding costs about 3.6% less than in 2019, even though the nominal price rose 21%.
- Slightly more than half of couples had all or most of their wedding paid for by parents, and weddings cost more when families contribute more.
- The average engagement ring ($4,600) equals about 0.65 months of median household income, far from the “three months’ salary” rule.
- States where weddings take more months of income also tend to have older brides and fewer married adults, a descriptive pattern rather than a cause.
- U.S. marriages rose to 2.13 million in 2024, 27% above the 2020 low, while the divorce rate fell to 2.3 per 1,000.
Wedding cost by state: the months-of-income index
The index divides each state’s average 2025 wedding cost by one month of its median household income. As a result, it measures the effort a celebration represents for a typical household, not what any one couple will spend.
Wedding cost by state, mapped in months of income
SHARE THIS CHART
Copy the code below to embed this chart on your site:
Full ranking of wedding cost by state: ranks 1–17
Rank State Avg. wedding cost Median household income Months of income Weeks 1 Rhode Island $51,000 $91,039 6.7 29 2 New York $49,000 $89,210 6.6 29 3 Vermont $47,000 $86,018 6.6 28 4 New Jersey $57,000 $107,797 6.3 27 5 Louisiana $34,000 $65,139 6.3 27 6 South Carolina $35,000 $73,672 5.7 25 7 Maine $37,000 $81,760 5.4 24 8 Pennsylvania $36,000 $81,473 5.3 23 9 Illinois $38,000 $86,676 5.3 23 10 Massachusetts $45,000 $106,539 5.1 22 11 Delaware $39,000 $92,520 5.1 22 12 Connecticut $42,000 $100,056 5.0 22 13 Florida $33,000 $80,846 4.9 21 14 Alabama $27,000 $67,663 4.8 21 15 Michigan $29,000 $75,832 4.6 20 16 California $39,000 $102,159 4.6 20 17 Texas $31,000 $82,625 4.5 20
Ranks 18–34
Rank State Avg. wedding cost Median household income Months of income Weeks 18 Ohio $28,000 $74,804 4.5 19 19 North Carolina $29,000 $77,638 4.5 19 20 Wisconsin $29,000 $80,213 4.3 19 21 Georgia $29,000 $81,847 4.3 18 22 Mississippi $21,000 $59,346 4.2 18 23 Maryland $38,000 $107,700 4.2 18 24 New Hampshire $37,000 $106,759 4.2 18 25 Kentucky $23,000 $66,447 4.2 18 26 Missouri $26,000 $75,485 4.1 18 27 Virginia $34,000 $99,322 4.1 18 28 Arizona $27,000 $82,940 3.9 17 29 Indiana $24,000 $74,516 3.9 17 30 Tennessee $24,000 $75,875 3.8 16 31 Hawaii $33,000 $105,013 3.8 16 32 New Mexico $22,000 $70,342 3.8 16 33 Colorado $31,000 $99,729 3.7 16 34 West Virginia $19,000 $61,340 3.7 16
Ranks 35–50
Rank State Avg. wedding cost Median household income Months of income Weeks 35 Minnesota $28,000 $92,297 3.6 16 36 Arkansas $19,000 $65,588 3.5 15 37 Oklahoma $19,000 $68,441 3.3 14 38 Iowa $21,000 $76,483 3.3 14 39 Montana $21,000 $77,099 3.3 14 40 North Dakota $22,000 $81,545 3.2 14 41 Nebraska $22,000 $81,614 3.2 14 42 Oregon $23,000 $86,953 3.2 14 43 South Dakota $21,000 $80,506 3.1 14 44 Kansas $20,000 $77,824 3.1 13 45 Washington $26,000 $101,946 3.1 13 46 Nevada $21,000 $85,198 3.0 13 47 Idaho $18,000 $84,234 2.6 11 48 Wyoming $17,000 $80,894 2.5 11 49 Alaska $19,000 $95,220 2.4 10 50 Utah $18,000 $99,311 2.2 9
Average wedding cost: The Knot 2026 Real Weddings Study (couples married in 2025; ceremony and reception, rounded to $1,000). Median household income: U.S. Census Bureau, ACS 2025 1-year. Months = cost ÷ (income ÷ 12). Ranked on unrounded values. The District of Columbia is not ranked because The Knot publishes no D.C. state figure.
The 15 states where a wedding takes the longest to fund
What the index shows
- 1.
4.8 months: the average 2025 wedding ($34,000) equals about 4.8 months of the U.S. median household income of $84,780 (2025).
— Gustavo Athayde analysis of The Knot Worldwide and U.S. Census Bureau, ACS 2025 data
- 2.
3.4 months: the median 2025 wedding ($24,000) takes about 3.4 months, or roughly 15 weeks, of the national median household income (2025).
— Gustavo Athayde analysis of The Knot 2026 Real Weddings Study and U.S. Census Bureau, ACS 2025 data
- 3.
6.7 months: Rhode Island ranks first in 2025, where an average wedding of $51,000 equals 6.7 months of the state’s $91,039 median household income.
— Gustavo Athayde analysis of The Knot 2026 Real Weddings Study and U.S. Census Bureau, ACS 2025 data
The top of the ranking
- 4.
6.6 and 6.6 months: New York ($49,000) and Vermont ($47,000) follow Rhode Island as the second- and third-highest states in months of income in 2025.
— Gustavo Athayde analysis of The Knot 2026 Real Weddings Study and U.S. Census Bureau, ACS 2025 data
- 5.
6.3 months: New Jersey has the costliest weddings of any state in 2025 ($57,000), yet ranks fourth because its median household income of $107,797 is the highest of any state.
— Gustavo Athayde analysis of The Knot 2026 Real Weddings Study and U.S. Census Bureau, ACS 2025 data
- 6.
6.3 months: Louisiana ranks fifth in 2025; its $34,000 average equals the national figure, set against a median household income of $65,139.
— Gustavo Athayde analysis of The Knot 2026 Real Weddings Study and U.S. Census Bureau, ACS 2025 data
The most attainable states
- 7.
2.2 months: Utah ranks 50th and has the most attainable wedding relative to income in 2025, an $18,000 average against a $99,311 median household income.
— Gustavo Athayde analysis of The Knot 2026 Real Weddings Study and U.S. Census Bureau, ACS 2025 data
- 8.
5 states come in under three months of income in 2025: Alaska, Idaho, Nevada, Utah and Wyoming, all in the West.
— Gustavo Athayde analysis of The Knot 2026 Real Weddings Study and U.S. Census Bureau, ACS 2025 data
- 9.
12 states reach five months of income or more in 2025, including eight of the nine Northeastern states; New Hampshire, at 4.2 months, is the exception.
— Gustavo Athayde analysis of The Knot 2026 Real Weddings Study and U.S. Census Bureau, ACS 2025 data
Regional patterns
- 10.
5.7 vs. 3.2 months: the average Northeastern state asks 5.7 months of income for a wedding, against 4.4 in the South, 3.9 in the Midwest and 3.2 in the West (2025, simple averages of states).
— Gustavo Athayde analysis of The Knot 2026 Real Weddings Study and U.S. Census Bureau, ACS 2025 data
- 11.
3.1 times: a wedding in first-ranked Rhode Island takes 3.1 times as many months of income as one in Utah, about 29 weeks against 9 (2025).
— Gustavo Athayde analysis of The Knot 2026 Real Weddings Study and U.S. Census Bureau, ACS 2025 data
- 12.
3.1 months: in South Dakota, home of this atelier, the average 2025 wedding ($21,000) equals 3.1 months of the $80,506 median household income, ranking 43rd.
— Gustavo Athayde analysis of The Knot 2026 Real Weddings Study and U.S. Census Bureau, ACS 2025 data
Wider measures of the index
- 13.
3.3 months: measured against the median income of married-couple families ($124,794), the average 2025 wedding takes about 3.3 months nationally.
— Gustavo Athayde analysis of The Knot Worldwide and U.S. Census Bureau, ACS 2025 (B19126) data
- 14.
r = 0.68: states where a wedding takes more months of income also tend to have an older median age at first marriage for women (correlation of 0.68) and a smaller share of married adults (-0.52), a descriptive pattern for 2025, not a cause.
— Gustavo Athayde analysis of The Knot 2026 Real Weddings Study and U.S. Census Bureau, ACS 2025 and U.S. Census Bureau, ACS 2025 (B12007) and U.S. Census Bureau, ACS 2025 (S1201) data
Wedding cost by state and region
Region States Avg. wedding cost Avg. median income Months of income Northeast 9 $44,600 $94,500 5.7 South 16 $28,400 $76,600 4.4 Midwest 12 $25,700 $79,800 3.9 West 13 $24,200 $90,100 3.2
Simple averages of the states in each Census region (D.C. excluded). Sources: The Knot 2026 Real Weddings Study; U.S. Census Bureau, ACS 2025; Gustavo Athayde analysis.
What this means for couples: the same celebration asks very different sacrifices of families in different states, and many couples respond by choosing the guest list, the season and the details that matter most to them. A single enduring element, such as a wedding monogram that carries from the invitation to the home, often outlasts the larger line items.
National wedding cost statistics
The Knot’s Real Weddings Study, based on more than 10,000 couples each year, is the reference for national wedding spending. However, the average and the median tell two different stories.
- 15.
$34,000: the average U.S. wedding cost in 2025, up from $33,000 in 2024, a level The Knot describes as holding steady, based on 10,474 couples married that year.
- 16.
$24,000: the median U.S. wedding cost in 2025, well below the average because a minority of large celebrations lifts the mean.
- 17.
25% of couples spent about $12,000 or less on their 2025 wedding, while another 25% spent more than $41,000.
Guests and cost per guest
- 18.
117 guests: the average 2025 wedding size, compared with 115 in 2023 and 116 in 2024.
— The Knot
- 19.
$292 per guest: the average 2025 spend per wedding guest, up $8 from 2024.
- 20.
1.3 days: hosting a single guest at $292 costs about 1.3 days of U.S. median household income (2025).
— Gustavo Athayde analysis of The Knot Worldwide and U.S. Census Bureau, ACS 2025 data
- 21.
92 vs. 141 guests: couples spending under $12,000 averaged 92 guests in 2025, while celebrations above $41,000 averaged 141.
— The Knot
Inflation and the long view
- 22.
$33,000: the average wedding cost in 2024, $2,000 less than in 2023, in a study of 16,956 couples.
- 23.
−3.6%: The Knot’s 2019 average of $28,000 is worth about $35,300 in 2025 dollars, so the 2025 average of $34,000 is 21% higher in nominal terms but about 3.6% lower after inflation.
— Gustavo Athayde analysis of The Knot 2026 Real Weddings Study and U.S. Bureau of Labor Statistics, CPI-U data
- 24.
$35,329: The Knot’s 2016 average, excluding the honeymoon, then described as an all-time high (historical; earlier study methodology).
Scale of the American wedding
- 25.
About 2 million U.S. couples married in 2025.
- 26.
$100 billion+: the size of the U.S. wedding industry to which 2025 couples contributed.
- 27.
14 months: the average engagement length among couples married in 2025, with roughly 40% engaged for 11 to 18 months.
The average wedding cost, before and after inflation
Wedding cost by state and city
Wedding cost by state tracks local prices, venues and traditions. For example, the Northeast and the largest metro areas lead; much of the Mountain West and the Plains celebrate at a fraction of the cost.
- 28.
$57,000: New Jersey had the highest average wedding cost of any state in 2025, and Wyoming the most modest, at $17,000.
- 29.
3.4 times: the average New Jersey wedding cost 3.4 times the Wyoming average in 2025.
— Gustavo Athayde analysis of The Knot 2026 Real Weddings Study data
- 30.
Five states averaged $45,000 or more in 2025: New Jersey ($57,000), Rhode Island ($51,000), New York ($49,000), Vermont ($47,000) and Massachusetts ($45,000).
- 31.
34 of 50 states had an average wedding cost below the $34,000 national figure in 2025, a sign of how strongly a few high-cost states lift the national mean.
— Gustavo Athayde analysis of The Knot 2026 Real Weddings Study and The Knot Worldwide data
- 32.
$48,400 vs. $29,000: the average wedding cost in the Mid-Atlantic region compared with the Midwest, in The Knot’s 2026 cost guide.
The largest metro areas
- 33.
$88,000: New York City had the highest average wedding cost among major metro areas in 2025, while El Paso, Texas, had the lowest, at $20,000.
- 34.
$54,000: Chicago’s 2025 average, followed by San Francisco and Boston at $51,000 each.
- 35.
$42,000: the average 2025 wedding in the Washington, D.C., metro area.
Other estimates of wedding cost by state
- 36.
$32,899: The Wedding Report’s 2025 national average, with a median spend of $18,231, an independent estimate close to The Knot’s.
- 37.
2,011,044 weddings took place in the United States in 2025, by The Wedding Report’s estimate.
Destination weddings
- 38.
79,271 weddings were held in Nevada in 2025, by The Wedding Report’s estimate, a reflection of the state’s long tradition as a wedding destination.
- 39.
24.8 per 1,000: Nevada’s marriage rate in 2024, the highest of any state, counted where weddings take place; Utah followed at 13.4 and Hawaii at 12.4.
Wedding cost in 23 metro areas
The incomes behind the wedding cost by state index
The denominator of the index is the Census Bureau’s American Community Survey for 2025, published in late October 2026. Incomes rose in real terms nationally; meanwhile, price levels differ widely by state.
- 40.
$84,780: the U.S. median household income in 2025, up 1.2% in real terms from 2024.
- 41.
$87,460: the 2025 median household income in the Current Population Survey, up 2.6% and the highest on record dating back to 1967.
- 42.
$107,797: New Jersey had the highest median household income of any state in 2025, statistically tied with Maryland ($107,700) and with the District of Columbia ($109,505).
Highest and lowest incomes
- 43.
9 jurisdictions had a median household income of $100,000 or more in 2025: the District of Columbia and eight states.
— Gustavo Athayde analysis of U.S. Census Bureau, ACS 2025 data
- 44.
$59,346: Mississippi had the lowest state median household income in 2025.
- 45.
14 states and Puerto Rico saw statistically significant real income gains in 2025; Rhode Island’s 6.2% was the largest among states, and Virginia rose 5.0%.
Family incomes and prices
- 46.
$124,794: the 2025 median income of married-couple families in the United States, against $105,101 for all families.
— U.S. Census Bureau, ACS 2025 (B19126) · U.S. Census Bureau, ACS 2025 (B19113)
- 47.
110.7: California had the highest price level of any state in 2024 (U.S. = 100), followed by Hawaii at 110.0 and New Jersey at 108.8.
Household budgets
- 48.
86.9: Arkansas had the lowest price level in 2024, followed by Mississippi at 87.0, so household budgets there stretch further than incomes alone suggest.
- 49.
$81,905: average annual spending by U.S. consumer units in 2025, up 4.3% from 2024.
— U.S. Bureau of Labor Statistics, Consumer Expenditure Survey
- 50.
63% of U.S. adults would cover a $400 emergency expense with cash or its equivalent in 2025, up from 50% in 2013.
Who pays for the wedding
Paying for a wedding remains a family undertaking in America. Parents still fund a large share, while couples who pay their own way tend to spend less.
- 51.
Slightly more than 50% of couples married in 2025 had all or most of their wedding paid for by their parents.
- 52.
62%: among couples spending more than $41,000 in 2025, family contributions covered 62% of the bill, and 77% of these couples prioritized the guest experience.
- 53.
67% of the most budget-minded 2025 couples had a friend officiate, and 44% relied on do-it-yourself decor.
- 54.
$39,600 vs. $25,500: in The Knot’s 2026 cost guide, weddings averaged $39,600 when the couple paid for the minority of costs, $29,700 when they paid the majority and $25,500 when they paid for everything.
What engaged couples report for 2026
- 55.
88% of couples marrying in 2026 are contributing financially to their wedding, 29% fully and 59% partially, in Zola’s survey of more than 11,500 couples.
- 56.
71% of 2026 weddings receive some financial help, and among those, 69% have both families contributing.
- 57.
23% less: couples paying 70% or more of their wedding out of pocket spend 23% less than others, in Zola’s 2026 survey of 720 recently married couples.
— Zola
- 58.
63% of the cost of luxury weddings above $100,000 is covered by families, in the same 2026 Zola survey.
— Zola
- 59.
15% vs. 9%: Gen Z couples are more likely than Millennials to have their 2026 weddings fully paid for by loved ones.
Savings and credit
- 60.
46% of newlyweds used savings as the main way to pay for their wedding in 2025, ahead of credit cards (24%), parents or relatives (16%) and personal loans (11%), in a survey of 1,050 newlyweds.
- 61.
67% of newlyweds said they went into debt to pay for their wedding, in a 2025 survey of 1,050 newlyweds.
- 62.
52% of newlyweds regret how much they spent on their wedding, divided evenly between those who wish they had spent more and those who wish they had spent less (2025).
Regret and outside support
- 63.
31% of 2025 couples sought additional financial support, including help from family or the use of credit cards and loans.
- 64.
31% of Americans who attended a wedding in the past five years said they had taken on debt to do so, in an April 2024 survey of 2,025 consumers.
Wedding cost by who pays
What this means for families: when parents contribute, a wedding becomes a statement of the whole family, not only of the couple. Many families mark that moment with a symbol of their own, such as a family crest that can be used for decades after the day itself.
Budgets, inflation and the economy
Couples planned through tariffs and persistent price increases. Most adjusted; in fact, many chose to spend more rather than less.
- 65.
41% of couples married in 2025 went over their wedding budget.
- 66.
Over 85% of 2025 couples said the economy had affected their planning and decisions.
- 67.
77% of 2025 couples who adjusted their budgets increased their spending rather than cutting it.
- 68.
1 in 3 couples marrying later in 2025 said tariffs affected their planning.
- 69.
$8,900 to $70,300: in The Knot’s 2026 cost guide, couples budgeting up to $15,000 spent $8,900 on average, those budgeting $15,001 to $40,000 spent $26,400, and those budgeting above $40,000 spent $70,300.
- 70.
84% of couples marrying in 2026 believe their wedding will cost more than the same wedding would have two years earlier.
- 71.
78% of 2026 couples worry the economy or tariffs will push their final bill above expectations.
- 72.
$36,000 and 145 guests: the average budget and guest count planned by couples marrying in 2026, by Zola’s measure of expected rather than final spending.
Where the wedding budget goes
The reception venue, catering and photography account for the largest lines of a wedding budget; by contrast, paper and stationery remain one of the smallest.
- 73.
13 vendors: the number of wedding professionals couples hire on average (2025).
- 74.
$12,900: the average cost of a wedding reception venue in 2025, the largest of the vendor costs The Knot reports.
- 75.
$80 per person: the average catering cost in 2025; flowers averaged $2,800.
- 76.
$3,000: the average wedding photographer cost in 2025; the wedding dress averaged $2,100.
- 77.
$4,500 vs. $1,800: the average 2025 cost of a reception band, compared with a DJ.
- 78.
$2,100: the average cost of a wedding or event planner in 2025.
- 79.
$510: the average 2025 spend on wedding invitations and stationery, about 1.5% of the average wedding.
- 80.
$3,000: the average cost of the couple’s wedding bands in 2025.
Engagement rings, craft and personalization
The engagement ring market has changed quickly, with lab-grown stones now the majority. Personalization, meanwhile, has also become the norm rather than the exception.
- 81.
$4,600: the average engagement ring spend in 2025, for an average center stone of 1.9 carats.
- 82.
0.65 months: the average engagement ring equals about 0.65 months, under three weeks, of U.S. median household income, far from the old “three months’ salary” rule (2025).
— Gustavo Athayde analysis of The Knot Worldwide and U.S. Census Bureau, ACS 2025 data
- 83.
61% of engagement rings bought in 2025 had a lab-grown center stone, a 239% increase since 2020.
- 84.
$7,000 vs. $4,300: the average 2025 natural-diamond engagement ring (1.6 carats) compared with the average lab-grown ring (2.0 carats).
Customization and proposals
- 85.
88% of 2025 engagement ring buyers made custom edits or had their ring fully custom-designed.
- 86.
Nearly 9 in 10 proposers had a ring in hand when they proposed, and December remains the most popular month to become engaged (2025).
- 87.
90% of couples married in 2025 aimed for an authentic, highly personalized wedding.
- 88.
100%: year-over-year growth in searches for custom crests, monograms and weekend-long storytelling in The Knot’s 2027 Wedding Trends Report (2026), a measure of search interest rather than a share of couples.
The craft trades
- 89.
49% of Signet Jewelers’ merchandise sales came from bridal jewelry in fiscal 2026.
- 90.
32,800 jewelers and precious stone and metal workers were employed in the United States in 2025, and 32% of them were self-employed.
- 91.
67% of the roughly 145,000 U.S. photographers were self-employed in 2025, a trade built largely on small, independent studios.
What this means for couples: personalization is now the expectation, from the ring to the invitation suite. A couple’s monogram or a custom wax seal carries that personal signature at a modest share of the overall budget.
Marriage in America today
Marriage in America has stabilized after the 2020 low. Americans marry later than they once did; at the same time, divorce has declined for two decades.
- 92.
2,128,446 marriages were recorded in the United States in 2024, a rate of 6.3 per 1,000 people, up from 6.1 in 2023.
- 93.
27%: marriages in 2024 were 27% above the 2020 low of 1,676,911.
— Gustavo Athayde analysis of CDC/NCHS National Vital Statistics System data
- 94.
2.3 per 1,000: the U.S. divorce rate in 2024, down from 4.0 in 2000 (reporting states).
- 95.
54% of children lived in an intact, biological married family in 2024, up from 51% in 2014, by the Institute for Family Studies’ analysis of Current Population Survey data.
Age at marriage and attitudes
- 96.
30.8 and 28.4: the median age at first marriage for men and women in 2025.
- 97.
25.6: Utah has the youngest median age at first marriage for women of any state in 2025 (men: 27.6), and Idaho and Wyoming share the highest share of married adults, 55.2%.
— U.S. Census Bureau, ACS 2025 (B12007) · U.S. Census Bureau, ACS 2025 (S1201)
- 98.
47.9% of Americans aged 15 and older were married in 2025.
- 99.
39% of Americans say it is very important that couples who have a child together marry, up 10 points since 2020 (2026).
— Gallup
- 100.
3,000+: in a study of more than 3,000 ever-married Americans, marriage duration was inversely associated with spending on the engagement ring and the wedding ceremony (historical, 2014 data; a correlation, not a cause).
Methodology
The months-of-income index of wedding cost by state divides The Knot’s average wedding cost for each state (2026 Real Weddings Study, couples married in 2025, ceremony and reception only, rounded to $1,000) by one-twelfth of the state’s median household income from the U.S. Census Bureau’s 2025 American Community Survey 1-year estimates (Table B19013, read on data.census.gov). The national figure uses The Knot’s headline average of $34,000; The Knot’s consumer page lists $34,200.
Averages are means, and the national median wedding ($24,000) is well below the mean, so the index describes the scale of an average celebration rather than a typical couple’s outlay. The Knot does not publish a sample size or margin of error for each state; small states may rest on fewer responses. Income estimates carry Census margins of error, which are small relative to the differences discussed. The District of Columbia is not ranked.
Inflation adjustments use the BLS CPI-U annual average; for 2025, the average of the 11 months published (October 2025 was not collected). Correlations and regional averages are descriptive and unweighted, and do not imply cause. Zola’s 2026 figures describe planned budgets of engaged couples and The Wedding Report’s are modeled estimates; we use The Knot as the primary cost source and cite the others for context.
About the author

Gustavo Athayde — Founder & Creative Director, GUSTAVO ATHAYDE
Gustavo Athayde is the founder and creative director of GUSTAVO ATHAYDE, a bespoke monogram atelier based in Sioux Falls, South Dakota. A graphic designer by training, he creates monograms, personal and family crests, heraldic emblems, signet designs and wax seals for individuals, families, couples and brands across the United States. Every commission is refined line by line into a symbol meant to be kept, used and passed down.
Follow the atelier on Instagram · Request a private consultation
Frequently asked questions
- How much does a wedding cost in 2026?
- The latest complete data, for weddings held in 2025, put the national average at $34,000 and the median at $24,000. Couples marrying in 2026 told Zola they plan to spend about $36,000.
- What is the average wedding cost by state?
- It ranges from $17,000 in Wyoming to $57,000 in New Jersey, according to The Knot’s 2026 Real Weddings Study of couples married in 2025. Relative to income, Rhode Island ranks first, at 6.7 months of median household income.
- Where is a wedding most affordable relative to income?
- Utah, where the average wedding of $18,000 equals 2.2 months of median household income. Alaska, Wyoming, Idaho and Nevada also come in under three months.
- How many months of income does the average wedding take?
- About 4.8 months of U.S. median household income for the average wedding, and 3.4 months for the median wedding, using 2025 data.
- Who usually pays for a wedding?
- Slightly more than half of couples married in 2025 had all or most of the wedding paid for by their parents. Among the largest weddings, families covered 62% of the bill.
- Is the average wedding more expensive than before the pandemic?
- In nominal dollars, yes: $34,000 in 2025 against $28,000 in 2019. Adjusted for inflation, the 2025 average is about 3.6% lower.
Cite this page
Source: Gustavo Athayde, "Wedding Cost by State 2026: How Many Months of Income a Wedding Takes", https://gustavoathayde.com/wedding-cost-by-state/Feel free to use these statistics and charts — we just ask for a link back to this page.
Sources
- "A Diamond Is Forever" and Other Fairy Tales (Francis-Tan and Mialon, SSRN)
- 2016 Real Weddings Study release (The Knot Worldwide)
- 2025 Real Weddings Study release (The Knot Worldwide via Business Wire, Feb. 27, 2025)
- 2026 Real Weddings Study press release (The Knot Worldwide, Feb. 18, 2026)
- America's Families and Living Arrangements: 2025 (U.S. Census Bureau)
- Americans More Likely to Say Parents Should Marry (Gallup)
- Average Wedding Guest List Size (The Knot)
- Consumer Expenditures — 2025 (U.S. Bureau of Labor Statistics)
- Consumer Price Index, U.S. city average, historical table (U.S. Bureau of Labor Statistics)
- Expensive Weddings guest survey, 2024 (LendingTree)
- Form 10-K for Fiscal 2026 (Signet Jewelers, SEC)
Sources H–M
- Household Income in States and Metropolitan Areas: 2025, ACSBR-028 (U.S. Census Bureau)
- How Much Does a Wedding Cost? (The Knot, 2026 Real Weddings Study)
- Income in the United States: 2025, P60-289 (U.S. Census Bureau)
- Is Marriage Back? Divorce Is Down, Family Stability Is Up (Institute for Family Studies)
- Jewelers and Precious Stone and Metal Workers, Occupational Outlook Handbook (U.S. Bureau of Labor Statistics)
- Lab-Grown Taking Over Engagement Ring Spending (Rapaport)
- Marital Status, ACS 2025 Table S1201 (U.S. Census Bureau)
- Marriage Rates by State: 1990, 1995, and 2000–2024 (CDC/NCHS, PDF)
- Median Age at First Marriage, ACS 2025 Table B12007 (U.S. Census Bureau)
- Median Family Income by Family Type, ACS 2025 Table B19126 (U.S. Census Bureau)
- Median Family Income, ACS 2025 Table B19113 (U.S. Census Bureau)
- Median Household Income, ACS 2025 Table B19013 (U.S. Census Bureau)
Sources N–Z
- National Marriage and Divorce Rate Trends, 2000–2024 (CDC/NCHS, PDF)
- Newlywed Wedding Debt Survey, 2025 (LendingTree)
- Number of Weddings by State 2025 (The Wedding Report)
- Photographers, Occupational Outlook Handbook (U.S. Bureau of Labor Statistics)
- Real Weddings Study 2026, data read-out (The Knot, PDF)
- Regional Price Parities by State, 2024 (U.S. Bureau of Economic Analysis, PDF)
- Survey of Household Economics and Decisionmaking: unexpected expenses (Federal Reserve Board)
- The First Look Report 2026 (Zola)
- U.S. wedding market statistics 2025 (The Wedding Report)
- Wedding Trends Report 2027 (The Knot via Business Wire, Sept. 28, 2026)
- What 10,000 Couples Who Just Got Married Can Tell You About Your Business (INSTORE)
- What Weddings Really Cost (Zola)