
The Most Popular Wedding Dates of 2027
A wedding date is the first detail a couple chooses and the one they will repeat for the rest of their lives, on anniversaries, engravings and family records. The most popular wedding dates of 2027 will be shaped less by numerology than by the calendar itself: the number of Saturdays in each month and the long weekends that surround them.
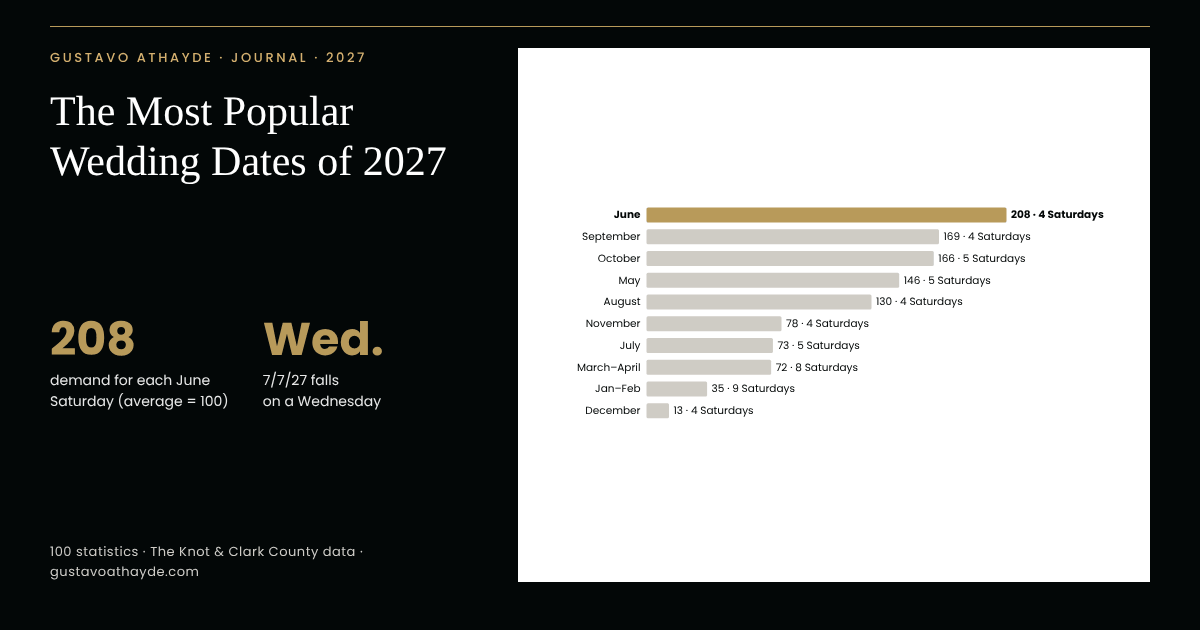
Our 2027 Saturday Demand Index finds that June Saturdays will be the scarcest, at 2.1 times the demand of an average Saturday, while October’s five Saturdays ease the pressure on the busiest month. The much-discussed 7/7/27, meanwhile, falls on a Wednesday. Below are 100 statistics, including our own analysis of 19 years of Las Vegas marriage licenses.
At a glance
Key takeaways
- June Saturdays will face the strongest demand of 2027, at 208 on our index, ahead of September (169) and October (166).
- October and June tie as the most popular wedding months at 16% each; 76% of couples marry between May and October.
- October 2027 has five Saturdays, so the same demand is spread across one more weekend than June’s four.
- 7/7/27 falls on a Wednesday and 10/10/27 on a Sunday; 2/27/27, 3/27/27 and 11/27/27 are the patterned Saturdays of the year.
- 2027 has no date written in a single repeating digit; the last was 2/22/22 and the next is 3/3/33.
- In Las Vegas, repeating-number dates such as 7/7/07, 11/11/11 and 2/22/22 drew 2.8× the usual license demand from 2007 to 2025; partial patterns drew only 1.3×.
- Friday is the busiest day for marriage licenses in Clark County (20.5% in 2025), and Valentine’s Day was its single busiest day of 2025.
- Memorial Day, Independence Day, Labor Day and Columbus Day all create three-day wedding weekends in 2027.
- 22% of couples married in 2025 included a wedding logo or monogram, and searches for custom crests and monograms doubled in 2026.
- U.S. marriages reached 2.13 million in 2024, 26.9% above the 2020 low.
The 2027 Saturday Demand Index
The index divides each month’s share of American weddings by the number of Saturdays it offers in 2027. A high score means more couples competing for each Saturday, and therefore the dates venues are likely to book first.
The 2027 Saturday Demand Index, by month
SHARE THIS CHART
Copy the code below to embed this chart on your site:
Every Saturday of 2027, ranked by month
Month Share of weddings Saturdays in 2027 Saturday dates Index June 16% 4 June 5, 12, 19, 26 208 September 13% 4 Sept. 4, 11, 18, 25 169 October 16% 5 Oct. 2, 9, 16, 23, 30 166 May 14% 5 May 1, 8, 15, 22, 29 146 August 10% 4 Aug. 7, 14, 21, 28 130 November 6%* 4 Nov. 6, 13, 20, 27 78 July 7%* 5 July 3, 10, 17, 24, 31 73 March–April 11%* 8 March 6, 13, 20, 27; April 3, 10, 17, 24 72 January–February 6%* 9 Jan. 2, 9, 16, 23, 30; Feb. 6, 13, 20, 27 35 December 1% 4 Dec. 4, 11, 18, 25 13
Share of weddings: The Knot Real Weddings Study data (page updated October 2026). *Derived from The Knot’s seasonal shares: July = summer 33% minus June and August; November = fall 35% minus September and October; March–April = spring 25% minus May; January–February = winter 7% minus December. Index = month share ÷ Saturdays in the month, with the average Saturday (100% ÷ 52) = 100. Gustavo Athayde analysis.
What the index shows
- 1.
208: each June 2027 Saturday faces the heaviest expected demand of any month in our 2027 Saturday Demand Index, about 2.1 times an average Saturday, because June holds 16% of weddings but only four Saturdays (June 5, 12, 19 and 26).
— Gustavo Athayde analysis of The Knot Real Weddings Study data
- 2.
169: September ranks second in the 2027 index, with 13% of weddings spread over four Saturdays (Sept. 4, 11, 18 and 25).
— Gustavo Athayde analysis of The Knot Real Weddings Study data
- 3.
166: October ties June as the most popular wedding month at 16%, yet ranks third in the 2027 index because its five Saturdays (Oct. 2, 9, 16, 23 and 30) spread the same demand across one more weekend.
— Gustavo Athayde analysis of The Knot Real Weddings Study data
- 4.
146: May 2027 scores 146, with 14% of weddings across five Saturdays, from May 1 to May 29.
— Gustavo Athayde analysis of The Knot Real Weddings Study data
The rest of the year
- 5.
130: August 2027 scores 130: 10% of weddings over four Saturdays (Aug. 7, 14, 21 and 28).
— Gustavo Athayde analysis of The Knot Real Weddings Study data
- 6.
73: July 2027 has five Saturdays for an estimated 7% of weddings, so a July Saturday carries about one-third of the demand of a June Saturday in 2027.
— Gustavo Athayde analysis of The Knot Real Weddings Study data
- 7.
13: December is the quietest month in the 2027 index, with 1% of weddings over four Saturdays, one of which is Christmas Day, December 25.
— Gustavo Athayde analysis of The Knot Real Weddings Study data
- 8.
45%: the 13 Saturdays of June, September and October 2027, one-quarter of the year’s Saturdays, sit in months that together hold an estimated 45% of American weddings.
— Gustavo Athayde analysis of The Knot Real Weddings Study data
The 2027 calendar at a glance
- 9.
4 months of 2027 have five Saturdays: January, May, July and October. Compared with 2026, July gains a fifth Saturday and August loses one.
— Gustavo Athayde analysis of the 2027 calendar
- 10.
0: 2027 has no date written in a single repeating digit, such as 2/22/22 or 11/11/11. The last one was February 22, 2022, and the next will be March 3, 2033.
— Gustavo Athayde analysis of the 2027 calendar
- 11.
3 of 18: of the 18 numeric “magic dates” on the Clark County Clerk’s 2027 list, only three fall on a Saturday: February 27, March 27 and November 27.
— Gustavo Athayde analysis of Travel Market Report, citing the Clark County Clerk data
What this means for couples: a June or September Saturday in 2027 is worth securing early, while a Friday, a Sunday or a July Saturday offers the same celebration with more choice. Whatever the date, it becomes part of the family record; many couples set it into a wedding monogram or an anniversary engraving
The most popular wedding dates and months
Across the country, the most popular wedding dates follow a steady rhythm: Saturdays in late spring and in fall. The Knot’s Real Weddings Study, built on more than 10,000 couples a year, sets the benchmark, and state vital records confirm the pattern.
- 12.
16%: October and June tie as the most popular wedding months, each with 16% of weddings in The Knot’s Real Weddings Study data (page updated October 2026).
- 13.
14% of couples now marry in May, the third-busiest month (The Knot, page updated October 2026).
- 14.
13% of weddings take place in September, and 10% in August (The Knot, page updated October 2026).
- 15.
1%: December is the least popular wedding month, with just 1% of couples marrying in it (The Knot, page updated October 2026).
Seasons and peak months
- 16.
76% of the 10,474 couples married in 2025 in The Knot’s study held their wedding between May and October.
- 17.
35% of couples marry from September through November and 33% from June through August, making fall the leading season (The Knot, page updated October 2026).
- 18.
Every year since 2015, fall has been the most popular season to marry, according to The Knot data (2026).
— The Knot
- 19.
17% of 2024 weddings took place in October, the most popular month of that year (The Knot 2025 Real Weddings Study).
The most popular single dates
- 20.
5 of 5: The Knot’s five most popular wedding dates of 2026 are all Saturdays: June 6, June 20, September 19, September 26 and October 10.
— The Knot
- 21.
All four October Saturdays of 2025 (October 4, 11, 18 and 25) made The Knot’s list of the five most popular dates of 2025; September 20 completed it.
— The Knot
- 22.
16 of 30: of the 30 dates on The Knot’s top-five lists for 2021 to 2026, 16 fell in October, 7 in September, 4 in June and 3 in May.
— Gustavo Athayde analysis of The Knot data
- 23.
60% of couples discuss the time of year for their wedding before they are even engaged, second only to overall size (64%), according to The Knot’s 2026 study.
What the states record
- 24.
13.42%: among 4,249 Zola couples planning 2023 weddings, September (13.42%) narrowly led June (13.35%) and May (13.33%).
- 25.
16.7% of Maine’s 10,087 marriages in 2025 took place in September (1,688), the state’s busiest month every year from 2021 to 2025.
- 26.
15.2%: October was Missouri’s busiest wedding month in 2023, with 5,378 of 35,396 marriages; September followed with 4,667.
Where the top dates fall
Wedding calendar 2027: holidays and patterned dates
The 2027 calendar places several federal holidays on Mondays and Fridays, creating long weekends in peak season. However, the patterned dates couples talk about most fall largely on weekdays.
A guide to notable 2027 wedding dates
Date (2027) Occasion Why it matters Sat., Feb. 27 2/27/27 First patterned Saturday of 2027; on the Clark County Clerk’s list Sat., March 27 3/27/27 Patterned Saturday early in the spring season Sat., May 29 Memorial Day weekend Holiday-weekend Saturday; May Saturdays score 146 Sat., June 5–26 June Saturdays Highest-demand Saturdays of 2027 (index 208) Sat., June 19 Juneteenth Federal holiday observed Friday, June 18 Sat., June 26 Last Saturday of June Historically the most chosen single day (1970–1987) Sat., July 3 Independence Day weekend July 4 is a Sunday, observed Monday, July 5 Wed., July 7 7/7/27 Patterned date on a weekday; suits intimate ceremonies Sat., July 17 7/17/27 Patterned Saturday in a five-Saturday July (index 73) Sat., Sept. 4 Labor Day weekend September Saturdays score 169 Sat., Oct. 2–30 October Saturdays Five Saturdays in the joint-busiest month (index 166) Sat., Oct. 9 Columbus Day weekend Three-day weekend in peak season Sun., Oct. 10 10/10/27 Patterned date on a Sunday Sat., Nov. 27 11/27/27 Patterned Saturday of Thanksgiving weekend Sat., Dec. 25 Christmas Day Federal holiday observed Friday, Dec. 24
Weekdays are calendar arithmetic; holidays from the U.S. Office of Personnel Management 2027 schedule. Index values from the 2027 Saturday Demand Index above.
Weekdays and holidays
- 27.
Wednesday: July 7, 2027 (7/7/27) falls on a Wednesday, whereas July 7, 2007, the busiest wedding date in Las Vegas history, was a Saturday.
— Gustavo Athayde analysis of the 2027 calendar
- 28.
Saturday: February 27, 2027 (2/27/27) is the first patterned date of the year to fall on a Saturday; March 27 (3/27/27) and November 27 (11/27/27) are the others.
— Gustavo Athayde analysis of the 2027 calendar
- 29.
Sunday: October 10, 2027 (10/10/27) falls on a Sunday, one year after Saturday, October 10, 2026, made The Knot’s list of the five most popular dates of 2026.
— Gustavo Athayde analysis of The Knot data
- 30.
Sunday: Valentine’s Day 2027 falls on a Sunday, and Washington’s Birthday is observed the next day, Monday, February 15, creating a three-day weekend.
Long weekends of 2027
- 31.
May 29: Memorial Day is Monday, May 31, 2027, so Saturday, May 29 is the holiday-weekend Saturday of late spring.
- 32.
June 19: Juneteenth falls on a Saturday in 2027; the federal holiday is observed on Friday, June 18.
- 33.
July 3: Independence Day falls on a Sunday in 2027 and is observed Monday, July 5, which places Saturday, July 3 inside a three-day weekend.
- 34.
September 4: Saturday, September 4 opens Labor Day weekend (Labor Day is Monday, September 6, 2027), and Columbus Day, Monday, October 11, gives Saturday, October 9 a three-day weekend as well.
Seasonal markers
- 35.
November 27: Thanksgiving is Thursday, November 25, 2027, so the patterned date 11/27/27 is the Saturday of Thanksgiving weekend.
- 36.
December 25: Christmas Day falls on a Saturday in 2027 and is observed on Friday, December 24.
- 37.
June 26: Saturday, June 26, 2027 is the last Saturday of June, the single day most often chosen for weddings in most years from 1970 to 1987 in the federal marriage-registration area.
— CDC/NCHS
Special wedding dates in history
Couples have long been drawn to memorable dates. The clearest record comes from Las Vegas, where the County Clerk counts every ceremony, and from national estimates published around each special date.
- 38.
4,492 couples married in Las Vegas on July 7, 2007 (“Lucky 7s”), the most popular wedding date in the city’s history.
- 39.
3,125 weddings took place in Las Vegas on November 11, 2011, the second most popular date on record.
- 40.
2,331 weddings made February 22, 2022 (2/22/22) the sixth most popular date in Las Vegas history.
- 41.
2,679 couples married in Clark County on 10/10/10 and 1,817 on 12/12/12 (2010 and 2012), according to eTurboNews (2021).
- 42.
1,838 couples married in Clark County on 12/13/14, a sequential date that fell on a Saturday in 2014, according to eTurboNews (2021).
- 43.
1,599 couples married in Las Vegas on 10/10/2020, a Saturday, even amid the pandemic, according to eTurboNews (2021).
- 44.
11 of Clark County’s most popular wedding dates of all time fell on Valentine’s Day, according to the county’s Marriage License Bureau (2024).
National estimates for special dates
- 45.
38,000+ couples in TheKnot.com’s registry planned to marry on Saturday, July 7, 2007, more than triple the average for a July Saturday in 2006.
- 46.
7,500 U.S. couples were expected to marry on Wednesday, 12/12/12, against just 485 on 12/12/11, according to David’s Bridal estimates for 2012.
- 47.
43% of brides said they would consider a “lucky,” numerically special wedding date, according to a 2012 David’s Bridal survey.
- 48.
4×: Tuesday, 11/12/13 was four times as popular as an average November Tuesday, according to TheKnot.com (2013).
- 49.
46,000 couples married on Saturday, February 14, 1987, the most popular wedding date of that year in the federal marriage-registration area, ahead of Saturday, June 20 (38,000).
— CDC/NCHS
What 19 years of Las Vegas marriage licenses show
Clark County, Nevada, publishes one row for every marriage license it issues. We read the files for 2007 through 2025 and counted licenses by issue date, which shows how strongly special dates and weekdays shape demand.
Special dates, measured
License demand around 17 special dates
Date Weekday Licenses that day Licenses, 3 days Vs. typical 2/22/22 Tue 607 2,136 3.9× 11/11/11 Fri 784 3,028 3.5× 7/7/07 Sat 975 3,765 3.3× 12/12/12 Wed 431 1,654 2.7× 10/10/10 Sun 423 2,442 2.7× 10/10/20 Sat 518 1,598 2.6× 8/8/08 Fri 682 2,279 2.5× 9/9/09 Wed 374 1,429 2.4× 12/13/14 Sat 417 1,742 2.1×
Smaller patterns
Date Weekday Licenses that day Licenses, 3 days Vs. typical 5/25/25 Sun 278 1,153 1.8× 4/24/24 Wed 276 921 1.7× 2/22/20 Sat 254 952 1.5× 3/23/23 Thu 260 764 1.4× 9/25/25 Thu 251 675 1.3× 2/2/22 Wed 221 691 1.3× 2/24/24 Sat 257 930 1.2× 12/21/21 Tue 188 582 1.2×
Clark County, Nevada, marriage license files, 2007–2025 (license issue dates). “3 days” = the date and the two days before it, since couples often obtain a license a day or two before the ceremony. “Vs. typical” divides that total by the average licenses issued on the same three weekdays that year. Wedding counts reported by the Clerk (4,492 on 7/7/07, for example) count ceremonies, not licenses. Gustavo Athayde analysis.
What the license files show
- 50.
70,598 marriage licenses were issued in Clark County, Nevada, in 2025, 8.1% fewer than the 76,779 issued in 2024.
— Gustavo Athayde analysis of Clark County Clerk data
- 51.
193 licenses a day: Clark County averaged about 193 marriage licenses per day in 2025; the median day saw 184.
— Gustavo Athayde analysis of Clark County Clerk data
- 52.
20.5% of 2025 Clark County licenses were issued on a Friday, the busiest day of the week, ahead of Thursday (16.3%) and Saturday (16.0%).
— Gustavo Athayde analysis of Clark County Clerk data
Busiest days and months
- 53.
478: Valentine’s Day 2025, a Friday, was the single busiest license day of the year in Clark County, about 2.5 times the daily average.
— Gustavo Athayde analysis of Clark County Clerk data
- 54.
444 and 431: Friday, May 23 and Saturday, May 24, the start of Memorial Day weekend, were the second- and third-busiest license days of 2025.
— Gustavo Athayde analysis of Clark County Clerk data
- 55.
10.6%: October was Clark County’s busiest month for marriage licenses in 2025, narrowly ahead of May (10.3%).
— Gustavo Athayde analysis of Clark County Clerk data
- 56.
1,623 licenses were issued on Friday, July 6, 2007, the eve of 7/7/07 and the busiest single day in Clark County’s license files from 2007 to 2025.
— Gustavo Athayde analysis of Clark County Clerk data
Special dates and Valentine’s Day
- 57.
3.9×: in the three days ending on Tuesday, 2/22/22, Clark County issued 2,136 licenses, 3.9× a typical stretch of the same weekdays that year, the strongest pull of any special date we measured from 2007 to 2025.
— Gustavo Athayde analysis of Clark County Clerk data
- 58.
3.3×: the three days ending on Saturday, 7/7/07 drew 3,765 licenses, 3.3× a typical Thursday-to-Saturday stretch of 2007; 11/11/11 reached 3.5×.
— Gustavo Athayde analysis of Clark County Clerk data
- 59.
2.8×: repeating-number dates, from 7/7/07 through 12/12/12 and 2/2/22 and 2/22/22, drew on average 2.8× the usual license demand, against 1.3× for partial patterns such as 3/23/23, 4/24/24 and 9/25/25 (2007–2025).
— Gustavo Athayde analysis of Clark County Clerk data
- 60.
1.7×: across 2007–2025, the three days ending on Valentine’s Day averaged 1.7× a typical stretch of the same weekdays; in the three years it fell on a Sunday (2010, 2016, 2021), the average was 1.8×.
— Gustavo Athayde analysis of Clark County Clerk data
Who marries in Las Vegas
- 61.
60.4% of 2025 Clark County licenses went to couples with a mailing address in another U.S. state, 23.9% to Nevadans and 15.4% to couples living abroad; the rest had no usable address.
— Gustavo Athayde analysis of Clark County Clerk data
- 62.
52.5% of the couples licensed in Clark County in 2025 were both marrying for the first time.
— Gustavo Athayde analysis of Clark County Clerk data
Valentine’s Day, year by year
The weekly rhythm
What this means for couples: a memorable date draws more couples only when it is easy to read at a glance and easy to celebrate. A patterned weekday date suits an intimate ceremony followed by a larger weekend celebration, and the numbers themselves can be set into a custom wax seal for the invitations
Engagement season and planning timelines
Most 2027 weddings will be planned during the coming engagement season. Couples move quickly once engaged, and the venue and the date are usually the first decisions.
- 63.
14 months: couples married in 2025 were engaged for 14 months on average, and roughly 40% were engaged for 11 to 18 months (The Knot).
- 64.
18 months is the average engagement among Zola couples planning 2026 weddings; Zola surveys couples while they plan, while The Knot surveys them after the wedding.
- 65.
Nearly 60% of couples married in 2025 started planning their wedding less than a month after getting engaged (The Knot).
- 66.
52% of couples married in 2024 began making plans 12 months ahead of their wedding (The Knot).
Venues and wedding websites
- 67.
Nearly 80% of couples begin researching wedding venues within two months of getting engaged, according to The Knot’s venue report on 2023 weddings.
- 68.
89% of couples married in 2025 booked a venue, second only to the wedding dress (91%) among the services in The Knot’s study.
- 69.
90% of couples married in 2025 created a wedding website (The Knot).
The stationery timeline
- 70.
6 to 8 months: The Knot advises sending save-the-dates six to eight months before the ceremony (2025); for a wedding on Saturday, October 9, 2027, that means between February 9 and April 9, 2027.
— The Knot
- 71.
6 to 8 weeks: wedding invitations should go out six to eight weeks before the wedding, and about nine to 10 weeks ahead for guests traveling from abroad (The Knot, 2026).
— The Knot
- 72.
3 to 4 weeks before the wedding is the ideal RSVP deadline, according to The Knot (2025).
— The Knot
Engagement season
- 73.
December remains the most popular month to get engaged, with Christmas Day the top day of the year, followed by Christmas Eve and Valentine’s Day (The Knot, 2025 data).
- 74.
Around 40% of proposals take place between Thanksgiving and Valentine’s Day, which places many 2027 weddings in this engagement season (The Knot, 2025 data).
- 75.
71% of wedding celebrations now span two to three days, so couples increasingly choose a weekend rather than a single date (The Knot, 2025 data).
Wedding cost by day and season
The date also shapes the budget, although the differences are smaller than many couples expect. Summer weddings cost the most, and weekday celebrations the least.
- 76.
$34,000 was the average cost of a U.S. wedding in 2025, for a celebration of 117 guests, according to The Knot’s survey of 10,474 couples.
- 77.
$292 per guest: couples married in 2025 spent an average of $292 per guest, up $8 from 2024 (The Knot).
- 78.
$35,400: weddings held from July to September cost the most in 2025, on average (The Knot).
- 79.
$33,200: weddings held from January to March, and from October to December, averaged $33,200 in 2025, the least of any quarter.
- 80.
$31,100: Thursday was the least expensive day of the week to marry in The Knot’s day-of-week comparison (page updated April 2025, based on its 2025 Real Weddings Study), against $33,100 for Saturday and $33,200 for Friday.
— The Knot
- 81.
10–20%: Friday and Sunday weddings typically save 10% to 20% on the venue, and weekday celebrations 30% to 40%, according to Zola’s venue cost guide (2026).
— Zola
- 82.
$36,000 is the average budget of Zola couples marrying in 2026, with 145 guests, based on more than 11,500 couples.
Stationery, monograms and personal details
Once the date is set, it travels on every piece of paper a couple sends. Personal symbols are gaining ground, with monograms and crests among the fastest-growing searches of 2026.
- 83.
22% of couples married in 2025 included a wedding logo or monogram in their celebration (The Knot 2026 Real Weddings Study).
- 84.
100%: searches for custom crests, monograms and weekend-long storytelling rose 100% year over year in The Knot’s January–June 2026 data from 1.7 million U.S. couples (2027 Wedding Trends Report).
- 85.
77%: searches for experiential stationery, such as ceremony program fans and pop-up menus, rose 77% year over year in 2026 (The Knot).
Stationery budgets
- 86.
$510 is what couples married in 2025 typically spent on their full wedding stationery suite (The Knot).
- 87.
$220 went to wedding invitations, including RSVP cards, and $150 to save-the-dates for the average couple married in 2025 (The Knot).
- 88.
49% of couples married in 2024 put a QR code on their save-the-dates or invitations, a practice that has grown 42% since 2021 (The Knot).
Tradition and heritage
- 89.
45%: Regency Garden invitation designs were up 45% and vintage themes 20%, according to The Knot (October 2025).
- 90.
60% of couples say incorporating their ethnicity, religion or culture into the wedding is important (The Knot, 2026).
- 91.
54% of Gen Z couples planning 2026 weddings include religious customs in their ceremony, compared with 38% of millennials (Zola).
What this means for couples: a date, two initials and a family name are the elements of a lasting symbol. A couple’s monogram or a family crest introduced on the save-the-date can carry through the invitation, the celebration and the home the couple builds together
Marriage in America today
Marriage in America has recovered from its 2020 low, and divorce continues to decline. Americans marry later than earlier generations did, yet the Saturday wedding remains the national custom.
- 92.
2,128,446 marriages were recorded in the United States in 2024, a rate of 6.3 per 1,000 people, up from 6.1 in 2023 (provisional).
- 93.
26.9%: U.S. marriages rose 26.9% between 2020 (1,676,911) and 2024, and 2024 finished 5.6% above pre-pandemic 2019.
— Gustavo Athayde analysis of CDC/NCHS National Vital Statistics System data
- 94.
About 5,815 weddings a day took place in the United States in 2024, on average.
— Gustavo Athayde analysis of CDC/NCHS National Vital Statistics System data
- 95.
24.8 marriages per 1,000 residents gave Nevada the highest marriage rate of any state in 2024, about four times the national rate; Utah (13.4) and Hawaii (12.4) followed.
- 96.
4.83 million Americans married in the 12 months before the 2024 American Community Survey: about 2.44 million men and 2.39 million women.
Age, stability and the Saturday tradition
- 97.
30.8 and 28.4: the median age at first marriage reached 30.8 for men and 28.4 for women in 2025, up from 23.5 and 21.1 in 1975.
- 98.
About 40% of recent first marriages are expected to end in divorce, down from roughly 47% for marriages begun in the 1990s, according to the Institute for Family Studies (2025).
- 99.
More than half of U.S. marriages were performed on a Saturday, according to the federal marriage statistics report for 1989 and 1990.
— CDC/NCHS
- 100.
Fifth Saturday: federal statisticians found that a month with a fifth Saturday “causes a substantial increase” in that month’s marriage total (1990), which matters in 2027 for January, May, July and October.
— CDC/NCHS
Methodology
Our 2027 Saturday Demand Index divides each month’s share of U.S. weddings, from The Knot’s Real Weddings Study data (page updated October 2026), by the number of Saturdays in that month in 2027, and scales the result so that an average Saturday equals 100. The Knot publishes shares for six months; July, November, March–April and January–February are derived from its seasonal totals, and shares are rounded, so the index describes relative demand rather than a forecast of bookings.
The Las Vegas figures are our count of the Clark County Clerk’s published marriage license files for 2007 through 2025, one row per license, by license issue date. Couples usually obtain the license a day or two before the ceremony, so we compare the three days ending on each date with the average for the same three weekdays in that year. The Clerk’s published wedding counts, such as 4,492 on 7/7/07, measure ceremonies and are cited separately.
Federal agencies stopped collecting detailed marriage data, including the month and day of the week, in 1996, so national figures by date come from The Knot, Zola and state vital records. The Knot surveys couples after the wedding and Zola surveys couples while they plan, which explains differences such as engagement length (14 vs. 18 months). Weekdays are calendar arithmetic; holidays follow the U.S. Office of Personnel Management 2027 schedule. All comparisons are descriptive.
About the author

Gustavo Athayde — Founder & Creative Director, GUSTAVO ATHAYDE
Gustavo Athayde is the founder and creative director of GUSTAVO ATHAYDE, a bespoke monogram atelier based in Sioux Falls, South Dakota. A graphic designer by training, he creates monograms, personal and family crests, heraldic emblems, signet designs and wax seals for individuals, families, couples and brands across the United States. Every commission is refined line by line into a symbol meant to be kept, used and passed down.
Follow the atelier on Instagram · Request a private consultation
Frequently asked questions
- What will be the most popular wedding dates of 2027?
- Saturdays in June, September and October. Our index gives June Saturdays the highest demand (208), followed by September (169) and October (166), whose five Saturdays (October 2, 9, 16, 23 and 30) spread demand more widely.
- What day of the week is 7/7/27?
- July 7, 2027 falls on a Wednesday. In Las Vegas, patterned dates still drew extra demand on weekdays, but couples who want a Saturday may prefer 2/27/27, 3/27/27 or 11/27/27.
- What is the most popular month to get married?
- October and June tie at 16% of weddings each in The Knot’s latest data, followed by May (14%) and September (13%). December is the least popular, at 1%.
Planning a 2027 date
- What is the most popular day of the week to get married?
- Saturday, according to The Knot; every one of its top-five dates from 2021 to 2026 was listed as a Saturday. In Las Vegas, Friday leads for licenses because couples obtain them the day before.
- Are numerology wedding dates a trend?
- They are a lasting tradition. In Las Vegas, repeating-number dates such as 7/7/07 and 2/22/22 drew 2.8× the usual license demand from 2007 to 2025. 2027 has no date in a single repeating digit; the next is 3/3/33.
- When should couples marrying in 2027 send save-the-dates?
- The Knot advises six to eight months before the wedding, and invitations six to eight weeks ahead. For a wedding on October 9, 2027, save-the-dates would go out between February 9 and April 9, 2027.
Cite this page
Source: Gustavo Athayde, "The Most Popular Wedding Dates of 2027", https://gustavoathayde.com/popular-wedding-dates/Feel free to use these statistics and charts — we just ask for a link back to this page.
Sources
- 12/12/12 weddings (HuffPost, December 2012)
- 2021 Las Vegas list of popular wedding dates released (eTurboNews, citing the Clark County Clerk)
- 2025 Real Weddings Study release (The Knot Worldwide via Business Wire, Feb. 27, 2025)
- 2026 Real Weddings Study release (The Knot Worldwide via Business Wire, Feb. 18, 2026)
- 2027's Most Popular Wedding Dates, From the Experts in Vegas (Travel Market Report, Oct. 2, 2026)
- 7/7/07 wedding rush (NBC News / Washington Post, July 2007)
- Advance Report of Final Marriage Statistics, 1987 (CDC/NCHS, Monthly Vital Statistics Report 38-12)
- Advance Report of Final Marriage Statistics, 1989 and 1990 (CDC/NCHS, Monthly Vital Statistics Report 43-12)
- Average Cost of Wedding Invitations (The Knot)
- Average Wedding Venue Cost (Zola)
- Best Day of the Week to Get Married (The Knot)
- Census Bureau Releases New Estimates on America's Families and Living Arrangements, 2025 (U.S. Census Bureau)
- Characteristics of People With a Marital Event in the Last Year, ACS 2024 Table S1251 (U.S. Census Bureau)
- Fall Is the Most Popular Wedding Season, plus the most popular wedding dates by year (The Knot)
- Federal Holidays 2027 (U.S. Office of Personnel Management)
- First Look Report 2023: Deep Data Dive (Zola)
- First Look Report 2026 (Zola)
- Is Marriage Back? Divorce Is Down, Family Stability Is Up (Institute for Family Studies)
- Is There an Off-Season for Weddings? (The Knot, Real Weddings Study data)
- Knot 2027 Wedding Trends Report (The Knot via Business Wire, Sept. 28, 2026)
- Las Vegas reveals 2025's top magic wedding dates (Clark County Clerk, weddings.vegas)
Sources M–Z
- Marriage License Statistics and data files (Clark County, Nevada, County Clerk)
- Marriage Rates by State: 1990, 1995, and 2000–2024 (CDC/NCHS, PDF)
- Marriages Occurring in Maine by Month, 2016–2025 (Maine CDC, PDF)
- Most Expensive and Least Expensive Times to Get Married (The Knot)
- National Marriage and Divorce Rate Trends, 2000–2024 (CDC/NCHS, PDF)
- Rare sequential date 11/12/13 becomes popular day for weddings (CBS Miami, 2013)
- Real Weddings Study 2026, data read-out (The Knot, PDF)
- Real Weddings Venue Report (The Knot, WeddingPro)
- Reported Marriages by Month of Event, Missouri 2023, Table 31 (Missouri DHSS, PDF)
- RSVP Timing and Guest Follow-Up (The Knot)
- The Knot Invitations trend data release (The Knot Worldwide via Business Wire, Oct. 14, 2025)
- Valentine's Day weddings release (Clark County Marriage License Bureau, weddings.vegas)
- Wedding Traditions Gen Z Is Bringing Back (Zola)
- Weddings in 2024: Real Weddings Study insights (The Knot)
- When to Send Save-the-Dates (The Knot)
- When to Send Wedding Invitations (The Knot)