
Where Americans Marry Youngest and Oldest 2026: 100 Marriage Age Statistics
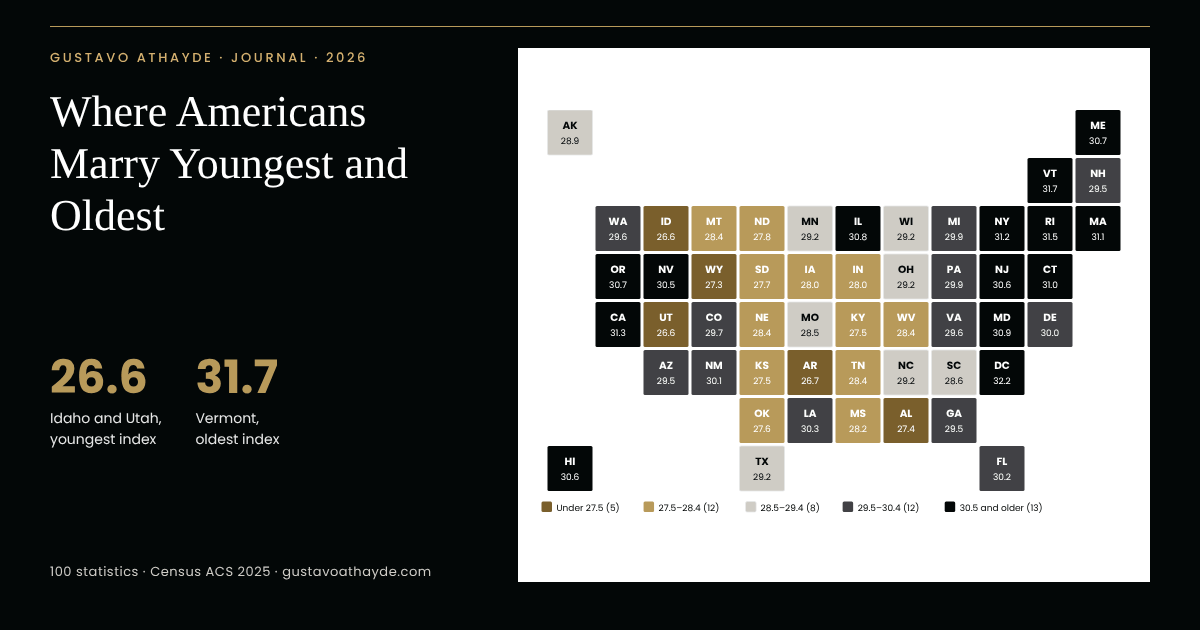
Where Americans marry youngest and oldest depends, above all, on the state. In 2025, the median age at first marriage by state ranged from 25.5 for women in Idaho to 32.8 for men in Vermont, and the national figures stood at 30.7 for men and 28.9 for women. Our Wedding Age Index, built from the newest Census Bureau data, ranks all 50 states with margins of error.
The finding that surprises most readers: the states that marry youngest — Idaho, Utah and Arkansas — also marry most often, and they show no higher divorce rates. The states that marry latest, led by Vermont, Rhode Island and California, have the highest shares of adults who have married only once.
At a glance
Key takeaways
- Idaho and Utah tie as the states where Americans marry youngest (index 26.6), with Arkansas statistically tied at 26.7.
- Vermont marries oldest (31.7); Rhode Island, California, New York and Massachusetts are statistically tied with it.
- 30.7 and 28.9 are the 2025 U.S. median ages at first marriage for men and women (ACS).
- Women in Idaho marry youngest (25.5); men in Vermont marry oldest (32.8).
- 8 states now have a median age at first marriage for women of 30 or older, up from 6 in 2021.
- 58.2% of Americans aged 25 to 34 have never married, from 41.5% in Wyoming to 67.6% in New York.
- Younger-marrying states marry more often — Utah has the highest marriage rate — and show no higher divorce rates.
- 76.3% of Americans who have ever married have married only once; New Jersey leads at 84.1%.
- 1956 was the record low (22.5 for men, 20.1 for women); both medians have since risen 8.3 years.
Age at first marriage by state: the full ranking
The Wedding Age Index averages the median age at which men and women in each state first marry, using the Census Bureau’s 2025 American Community Survey. A lower index means couples marry younger. Because the survey is a sample, each value carries a margin of error, and states whose values overlap are described as statistically tied.
Map: age at first marriage by state
SHARE THIS CHART
Copy the code below to embed this chart on your site:
The national benchmark
- 1.
30.7 for men and 28.9 for women is the median age at first marriage in the United States in 2025 (margins of error ±0.2 and ±0.1 years), the latest American Community Survey estimate.
- 2.
29.8 years is the national Wedding Age Index in 2025 — the average of the median ages at first marriage for men and women, the measure used to rank the states in this article.
— Gustavo Athayde analysis of Census ACS 2025, B12007 data
- 3.
26.6 years: Idaho and Utah share the No. 1 spot as the states where Americans marry youngest in 2025, with identical Wedding Age Index values (Idaho ±0.5, Utah ±0.4).
— Gustavo Athayde analysis of Census ACS 2025, B12007 data
- 4.
26.7 years puts Arkansas third in 2025, statistically tied with Idaho and Utah; Wyoming (27.3) also cannot be separated from the two leaders, and North Dakota (27.8) cannot be separated from Idaho, given their wider margins of error.
— Gustavo Athayde analysis of Census ACS 2025, B12007 data
The youngest and oldest states
- 5.
31.7 years makes Vermont the state where Americans marry oldest in 2025 (±2.0), followed by Rhode Island (31.5), California (31.3), New York (31.2) and Massachusetts (31.1); these five are statistically tied with one another, and Vermont’s wide margin of error means it cannot be separated from about 20 states.
— Gustavo Athayde analysis of Census ACS 2025, B12007 data
- 6.
5.1 years separate the youngest-marrying states (Idaho and Utah) from the oldest-marrying state (Vermont) in 2025.
— Gustavo Athayde analysis of Census ACS 2025, B12007 data
- 7.
32.8 for men and 31.5 for women are the median ages at first marriage in the District of Columbia in 2025 (±1.3 and ±1.8): the women’s figure is above every state and the men’s matches the highest state, Vermont; as a city, D.C. is shown alongside the ranking but not ranked.
- 8.
10 states have a Wedding Age Index below 28 years in 2025, while 17 states sit at 30 or above.
— Gustavo Athayde analysis of Census ACS 2025, B12007 data
How the states compare with the nation
- 9.
24 states marry at a statistically younger age than the nation as a whole in 2025 and 11 at a statistically older age; the other 15 cannot be distinguished from the national figure.
— Gustavo Athayde analysis of Census ACS 2025, B12007 data
- 10.
30.2 for men and 28.2 for women is the median age at first marriage in the Midwest in 2025, the youngest of the four Census regions; the South is close behind (30.2 and 28.3), while the Northeast is oldest (31.4 and 30.1).
- 11.
No. 21: Texas (29.2, tied with Minnesota, North Carolina, Ohio and Wisconsin) is the youngest-marrying of the five most populous states in 2025, ahead of Pennsylvania (No. 32), Florida (No. 36), New York (No. 47) and California (No. 48).
— Gustavo Athayde analysis of Census ACS 2025, B12007 data
- 12.
35.2 for men and 32.3 for women are the median ages at first marriage in Puerto Rico in 2025, higher than in any state.
The 50 states ranked, youngest to oldest (1–17)
Rank State Index ±MOE Men Women Since 2021 1 Idaho 26.6 ±0.5 27.7 25.5 −0.2 1 Utah 26.6 ±0.4 27.6 25.6 +0.8 3 Arkansas 26.7 ±0.5 27.6 25.8 +0.0 4 Wyoming 27.3 ±1.1 28.3 26.3 +0.2 5 Alabama 27.4 ±0.4 28.3 26.4 −1.0 6 Kansas 27.5 ±0.4 28.5 26.4 −0.4 6 Kentucky 27.5 ±0.5 28.1 26.8 +0.4 8 Oklahoma 27.6 ±0.5 28.3 26.8 +0.2 9 South Dakota 27.7 ±0.8 28.8 26.5 −1.0 10 North Dakota 27.8 ±1.1 28.8 26.7 −1.2 11 Indiana 28.0 ±0.4 29.2 26.7 +0.2 11 Iowa 28.0 ±0.6 28.8 27.1 −0.5 13 Mississippi 28.2 ±0.6 29.1 27.2 −0.9 14 Montana 28.4 ±0.8 29.5 27.2 −0.6 14 Nebraska 28.4 ±0.6 29.6 27.1 +0.7 14 Tennessee 28.4 ±0.4 29.1 27.7 +0.5 14 West Virginia 28.4 ±0.7 29.5 27.2 −0.9
The middle of the ranking (18–34)
Rank State Index ±MOE Men Women Since 2021 18 Missouri 28.5 ±0.4 29.1 27.8 +0.3 19 South Carolina 28.6 ±0.5 29.6 27.5 −0.6 20 Alaska 28.9 ±1.9 30.1 27.7 +0.9 21 Minnesota 29.2 ±0.3 30.0 28.3 −0.6 21 North Carolina 29.2 ±0.4 30.5 27.9 +0.3 21 Ohio 29.2 ±0.3 30.1 28.2 −0.2 21 Texas 29.2 ±0.3 30.1 28.3 +0.8 21 Wisconsin 29.2 ±0.4 30.5 27.8 −0.4 26 Arizona 29.5 ±0.4 30.9 28.0 +0.4 26 Georgia 29.5 ±0.4 30.6 28.3 +0.3 26 New Hampshire 29.5 ±0.7 31.2 27.7 −0.7 29 Virginia 29.6 ±0.3 30.3 28.9 +0.1 29 Washington 29.6 ±0.3 30.7 28.5 +0.8 31 Colorado 29.7 ±0.5 31.0 28.4 +0.2 32 Michigan 29.9 ±0.3 30.7 29.0 +0.4 32 Pennsylvania 29.9 ±0.2 30.6 29.2 −0.1 34 Delaware 30.0 ±1.3 31.7 28.2 −0.2
The oldest-marrying states (35–50), D.C. and the U.S.
Rank State Index ±MOE Men Women Since 2021 35 New Mexico 30.1 ±1.0 31.5 28.7 +0.7 36 Florida 30.2 ±0.3 31.1 29.2 −0.4 37 Louisiana 30.3 ±0.7 30.9 29.6 +0.6 38 Nevada 30.5 ±0.5 31.2 29.8 +0.1 39 Hawaii 30.6 ±0.8 30.9 30.2 +0.8 39 New Jersey 30.6 ±0.2 31.3 29.8 +0.2 41 Maine 30.7 ±1.0 31.9 29.5 +1.9 41 Oregon 30.7 ±0.7 32.7 28.7 +1.0 43 Illinois 30.8 ±0.3 31.5 30.1 +0.4 44 Maryland 30.9 ±0.4 31.8 29.9 +0.4 45 Connecticut 31.0 ±0.5 31.8 30.1 +0.4 46 Massachusetts 31.1 ±0.3 31.6 30.6 −0.2 47 New York 31.2 ±0.3 31.8 30.6 +0.0 48 California 31.3 ±0.2 32.2 30.3 +0.4 49 Rhode Island 31.5 ±1.3 32.2 30.7 +0.5 50 Vermont 31.7 ±2.0 32.8 30.5 +1.0 — District of Columbia 32.2 ±1.1 32.8 31.5 +0.2 — United States 29.8 ±0.1 30.7 28.9 +0.2
Index = average of the median ages at first marriage for men and women (ACS 2025 1-year, table B12007). MOE = 90% margin of error of the index. States with equal index values share a rank; differences smaller than the combined margins of error are statistically tied. D.C. is shown but not ranked.
What this means for couples: there is no single American wedding age. A bride in Idaho and a bride in Massachusetts are each marrying close to the norm of their own state, about five years apart. For a couple planning heirloom pieces — a wedding monogram or a shared couple’s cipher — the age matters less than the intention to make something that lasts.
Where Americans marry youngest
The youngest weddings in America cluster in the Mountain West, the Great Plains and the Upper South — states with young populations, high marriage rates and strong family and faith traditions.
The youngest brides and grooms
- 13.
25.5 is the median age at which women in Idaho first marry in 2025 (±0.4), the lowest of any state, just ahead of Utah (25.6 (±0.4)) and Arkansas (25.8 (±0.4)).
- 14.
27.6 is the median age at first marriage for men in Arkansas and Utah in 2025 (±0.9 and ±0.7), the youngest grooms in the nation; Idaho follows at 27.7 (±1.0).
- 15.
11 states have a median age at first marriage for women below 27 in 2025: Alabama, Arkansas, Idaho, Indiana, Kansas, Kentucky, North Dakota, Oklahoma, South Dakota, Utah and Wyoming.
— Gustavo Athayde analysis of Census ACS 2025, B12007 data
- 16.
24.5 was the median age at first marriage for women in Utah in 2021 — the only state under 25 that year; by 2025 it had risen to 25.6, and Utah now shares first place with Idaho.
— Gustavo Athayde analysis of Census ACS 2025, B12007 and Census ACS 2021, B12007 data
Utah, Idaho and the Mountain West
- 17.
32.6 years is the median age of Utah’s population in 2025, the youngest of any state; Maine has the oldest population, at 44.9.
- 18.
54.9% of Utah adults are married, the highest share in the nation, according to the University of Utah’s Kem C. Gardner Policy Institute (2025).
- 19.
24.4 women in Utah married in the past year for every 1,000 women aged 15 and over in 2025 (±3.3), the highest marriage rate of any state, statistically tied with Wyoming (21.4) and Kansas (20.6).
— Gustavo Athayde analysis of Census ACS 2025, B12501 data
The Plains and the Upper South
- 20.
13.2% of never-married young adults aged 22 to 39 in the Provo, Utah, region married in a given year, the highest rate of any area in the Institute for Family Studies’ 2026 “Mapping Marriage in America” report (ACS 2020–2024).
- 21.
No. 5: Alabama (27.4) is the youngest-marrying state east of the Mississippi River in 2025, followed by Kentucky (No. 6, 27.5).
— Gustavo Athayde analysis of Census ACS 2025, B12007 data
- 22.
7 of the 10 youngest-marrying states in 2025 lie in the Mountain West and the Great Plains — Idaho, Utah, Wyoming, Kansas, Oklahoma, South Dakota and North Dakota — joined by Arkansas, Alabama and Kentucky.
— Gustavo Athayde analysis of Census ACS 2025, B12007 data
Where Americans marry oldest
At the other end of the ranking, New England, New York and California marry latest. These states also have some of the highest shares of adults who have married only once.
The oldest brides and grooms
- 23.
32.8 is the median age at first marriage for men in Vermont in 2025 (±1.8), the highest of any state; Oregon (32.7 (±1.0)), California (32.2 (±0.3)) and Rhode Island (32.2 (±2.5)) follow.
- 24.
30.7 is the median age at first marriage for women in Rhode Island in 2025 (±0.9), the highest of any state, with Massachusetts (30.6 (±0.2)) and New York (30.6 (±0.3)) close behind.
- 25.
8 states have a median age at first marriage for women of 30 or older in 2025 — California, Connecticut, Hawaii, Illinois, Massachusetts, New York, Rhode Island and Vermont — up from 6 in 2021.
— Gustavo Athayde analysis of Census ACS 2025, B12007 and Census ACS 2021, B12007 data
- 26.
31 states have a median age at first marriage for men of 30 or older in 2025, compared with 32 in 2021.
— Gustavo Athayde analysis of Census ACS 2025, B12007 and Census ACS 2021, B12007 data
New England and the coasts
- 27.
±0.2 years is the margin of error on California’s Wedding Age Index (31.3) in 2025; even with such a precise estimate, California is statistically tied with Vermont, Rhode Island, New York and Massachusetts at the top of the ranking.
— Gustavo Athayde analysis of Census ACS 2025, B12007 data
- 28.
6 of the 10 oldest-marrying states in 2025 are in the Northeast: Vermont, Rhode Island, New York, Massachusetts, Connecticut and Maine.
— Gustavo Athayde analysis of Census ACS 2025, B12007 data
- 29.
No. 43: Illinois (30.8) is the oldest-marrying state in the Midwest in 2025, while Oregon (30.7) is the oldest-marrying state in the West after California.
— Gustavo Athayde analysis of Census ACS 2025, B12007 data
- 30.
32.4 was the median age at first marriage for men in Connecticut, Massachusetts and New Hampshire in 2024, the highest in the prior year’s ACS, according to Bowling Green State University’s National Center for Family & Marriage Research.
Brides and grooms: the two medians
Men marry later than women in every state, but the gap has narrowed over the past century and varies widely from one state to the next.
Chart: brides and grooms by state
The gap between grooms and brides
- 31.
1.8 years is the gap between the median ages at first marriage of men (30.7) and women (28.9) in 2025.
— Gustavo Athayde analysis of Census ACS 2025, B12007 data
- 32.
0.7 years separate grooms (30.9) and brides (30.2) in Hawaii in 2025, the narrowest gap of any state; Massachusetts (1.0) and New York (1.2) follow.
— Gustavo Athayde analysis of Census ACS 2025, B12007 data
- 33.
4.0 years is the widest gap between the median ages of men and women at first marriage, in Oregon (32.7 and 28.7) in 2025; Delaware and New Hampshire follow at 3.5 years.
— Gustavo Athayde analysis of Census ACS 2025, B12007 data
Couples close in age
- 34.
30.8 for men and 28.4 for women is the estimated median age at first marriage in 2025 in the Current Population Survey, the Census Bureau’s long-running national series.
- 35.
More than a third of U.S. opposite-sex couples living together in 2025, married and unmarried, were within a year of the same age.
- 36.
51% of opposite-sex marriages in 2022 had spouses two years apart in age or less, up from 46% in 2000, according to Pew Research Center analysis of Census data.
Newlyweds and never-married young adults
- 37.
2,461,665 men and 2,422,358 women married in the 12 months before their 2025 American Community Survey interview.
- 38.
62.8% of men and 53.5% of women aged 25 to 34 had never married in 2025.
— Gustavo Athayde analysis of Census ACS 2025, B12002 data
- 39.
About two years has been the gap between men’s and women’s median age at first marriage every year from 2008 through 2024, according to NCFMR’s analysis of the ACS.
Five years of change, 2021–2025
Between 2021 and 2025, the national median moved only slightly, but several states shifted by a year or more. Changes are compared against the combined margins of error for both years.
Chart: where marriage age changed
The national trend
- 40.
28.6 to 28.9: the national median age at first marriage for women rose by three-tenths of a year between 2021 and 2025, while the figure for men moved from 30.6 to 30.7.
- 41.
32 states saw their Wedding Age Index rise between 2021 and 2025, while 18 saw it fall.
— Gustavo Athayde analysis of Census ACS 2025, B12007 and Census ACS 2021, B12007 data
- 42.
8 states show an increase larger than the combined margin of error between 2021 and 2025 — California, Illinois, Maine, Michigan, Oregon, Texas, Utah and Washington — and 4 show a clear decrease: Alabama, Minnesota, Mississippi and West Virginia.
— Gustavo Athayde analysis of Census ACS 2025, B12007 and Census ACS 2021, B12007 data
States that changed most
- 43.
1.1 years younger: Alabama’s Wedding Age Index fell from 28.4 in 2021 to 27.4 in 2025, the largest decline beyond the margin of error.
— Gustavo Athayde analysis of Census ACS 2025, B12007 and Census ACS 2021, B12007 data
- 44.
+0.8 years: Texas posted the clearest increase among the large states, from 28.5 in 2021 to 29.2 in 2025.
— Gustavo Athayde analysis of Census ACS 2025, B12007 and Census ACS 2021, B12007 data
- 45.
+1.9 years is Maine’s rise between 2021 and 2025, the largest of any state (28.8 to 30.7), though Maine’s smaller sample gives it a wider margin of error.
— Gustavo Athayde analysis of Census ACS 2025, B12007 and Census ACS 2021, B12007 data
Regions and the long view
- 46.
25.8 was Utah’s Wedding Age Index in 2021, the youngest of any state; Utah now shares first place with Idaho. At the other end, Massachusetts was the oldest-marrying state in 2021 (31.3), while Vermont holds that spot in 2025 (31.7).
— Gustavo Athayde analysis of Census ACS 2025, B12007 and Census ACS 2021, B12007 data
- 47.
+0.4 years: the West posted the largest regional increase in the median age at first marriage for men between 2021 and 2025 (31.0 to 31.4) and matched the South for the largest increase among women (West 28.9 to 29.3; South 27.9 to 28.3); the Midwest did not change.
- 48.
+2.1 years: the median age at first marriage for women in Utah has risen from 23.5 in 2008 to 25.6 in 2025, less than the nation’s rise for women over the same period (26.2 to 28.9).
— Gustavo Athayde analysis of Census ACS 2025, B12007 and NCFMR, Bowling Green State University data
Median age at first marriage by region
Region Men 2021 Men 2025 Women 2021 Women 2025 Midwest 30.2 30.2 28.2 28.2 South 30.1 30.2 27.9 28.3 West 31.0 31.4 28.9 29.3 Northeast 31.4 31.4 30.0 30.1
Median age at first marriage by Census region. Source: U.S. Census Bureau, ACS 1-year, table B12007.
A century of marriage timing
The Census Bureau’s historical series shows that today’s later weddings are a return to — and now a step beyond — the pattern of the late 1800s, after the unusually young marriages of the postwar era.
Chart: 135 years of marriage timing
From 1890 to the postwar low
- 49.
26.1 for men and 22.0 for women was the median age at first marriage in 1890, the first year of the Census Bureau’s historical series.
- 50.
22.5 for men and 20.1 for women in 1956 were the youngest median ages at first marriage on record, at the height of the postwar marriage boom.
- 51.
8.3 years is how much later both men and women now marry than in 1956: the median rose from 22.5 to 30.8 for men and from 20.1 to 28.4 for women by 2025.
— Gustavo Athayde analysis of Census, table MS-2 data
- 52.
2020 was the first year in which the national median age at first marriage for men reached 30 (30.5) in the Current Population Survey series.
— Gustavo Athayde analysis of Census, table MS-2 data
Crossing 30
- 53.
28.6 is the highest median age at first marriage for women recorded in the CPS series (2021, 2024 and one of the two 2022 estimates); unlike the figure for men, it has never reached 30.
— Gustavo Athayde analysis of Census, table MS-2 data
- 54.
4.1 years separated grooms and brides in 1890 (26.1 and 22.0); by 2025, the gap had narrowed to 2.4 years (30.8 and 28.4).
— Gustavo Athayde analysis of Census, table MS-2 data
- 55.
23.5 for men and 21.1 for women was the median age at first marriage in 1975, half a century before the 2025 estimates of 30.8 and 28.4.
- 56.
26.8 for men and 25.1 for women was the median age at first marriage in 2000, at the turn of the century.
Households and marriage rates
- 57.
47% of U.S. households were married couples in 2025, compared with 66% in 1975.
- 58.
8.2 marriages per 1,000 people was the U.S. marriage rate in 2000; it stood at 6.3 in 2024, after a low of 5.1 in 2020.
— CDC/NCHS
- 59.
2,128,446 marriages were recorded in the United States in 2024, the most since 2018.
— CDC/NCHS
Median age at first marriage, selected years
Year Men Women Gap 1890 26.1 22.0 4.1 1920 24.6 21.2 3.4 1940 24.3 21.5 2.8 1956 22.5 20.1 2.4 1975 23.5 21.1 2.4 1990 26.1 23.9 2.2 2000 26.8 25.1 1.7 2010 28.2 26.1 2.1 2020 30.5 28.1 2.4 2025 30.8 28.4 2.4
Estimated median age at first marriage. Source: U.S. Census Bureau, Current Population Survey, historical table MS-2 (1890–1940 from the decennial census).
Married by 35? Young adults state by state
The age at first marriage shapes how many young adults are married at any given time. The states where people marry youngest are also the states where most 25-to-34-year-olds have already wed.
Chart: never married at 25 to 34
Never married at 25 to 34
- 60.
58.2% of Americans aged 25 to 34 had never married in 2025.
— Gustavo Athayde analysis of Census ACS 2025, B12002 data
- 61.
41.5% of adults aged 25 to 34 in Wyoming had never married in 2025, the lowest share of any state, statistically tied with Idaho (41.8%) and Utah (42.5%).
— Gustavo Athayde analysis of Census ACS 2025, B12002 data
- 62.
67.6% of New Yorkers aged 25 to 34 had never married in 2025, the highest share of any state, statistically tied with Massachusetts (67.3%); California follows (65.8%).
— Gustavo Athayde analysis of Census ACS 2025, B12002 data
- 63.
0.96 is the correlation in 2025 between a state’s Wedding Age Index and the share of its 25-to-34-year-olds who have never married — in states where people marry younger, most young adults are already married.
— Gustavo Athayde analysis of Census ACS 2025, B12007 and Census ACS 2025, B12002 data
Young adults nationwide
- 64.
28.5% of Americans aged 35 to 44 had never married in 2025; the share was lowest in Idaho (16.6%) and Utah (18.5%) and highest in Rhode Island (39.5%).
— Gustavo Athayde analysis of Census ACS 2025, B12002 data
- 65.
62% to 44%: the share of young adults aged 25 to 34 who had ever married fell by 18 percentage points between 2005 and 2023, according to a 2025 Census Bureau working paper.
- 66.
58% of adults aged 18 to 24 lived in their parental home in 2025.
- 67.
45% of young adults aged 25 to 34 in 1975 had reached all four traditional milestones of adulthood — living away from their parents, working, married and with children — the largest share of any pattern that year (Census Bureau, 2025).
- 68.
25% of 40-year-olds in the United States had never been married in 2021, a record high, according to Pew Research Center analysis of Census data.
Young Americans and marriage plans
- 69.
69% of never-married adults aged 18 to 34 say they want to get married one day (Pew Research Center survey, fall 2023).
- 70.
67% of 12th graders said in 2023 that they will likely choose to marry someday, down from 80% in 1993 (Monitoring the Future, analyzed by Pew Research Center).
- 71.
21% of first-time newlyweds were aged 18 to 24 in 2024, down from 32% in 2008, while the share aged 30 to 34 rose from 17% to 24%.
- 72.
23% of 25-year-old women and 20% of 25-year-old men have ever married, according to an Institute for Family Studies estimate (2024).
Marriage and divorce rates by state
Marriage rates measure how many people marry each year. The ACS counts residents who married in the past year; the CDC counts weddings where they take place, which is why destination states rank high in its records.
Marriage rates in the ACS
- 73.
16.7 women married in the past year for every 1,000 women aged 15 and over in 2025, up from 14.9 in 2021.
— Gustavo Athayde analysis of Census ACS 2025, B12501 and Census ACS 2021, B12501 data
- 74.
12.1 women married per 1,000 women aged 15 and over in Connecticut in 2025, the lowest rate among the states, statistically tied with Montana (12.8) and Maine (13.1).
— Gustavo Athayde analysis of Census ACS 2025, B12501 data
- 75.
−0.64 is the 2025 correlation between a state’s Wedding Age Index and its marriage rate: the states that marry younger also marry more often.
— Gustavo Athayde analysis of Census ACS 2025, B12007 and Census ACS 2025, B12501 data
- 76.
6.6 women divorced in the past year for every 1,000 women aged 15 and over in 2025.
— Gustavo Athayde analysis of Census ACS 2025, B12503 data
- 77.
2.52 marriages took place for every divorce among American women in the year before the 2025 survey.
— Gustavo Athayde analysis of Census ACS 2025, B12501 and Census ACS 2025, B12503 data
Divorce and marriage ratios
- 78.
−0.06 is the correlation between a state’s Wedding Age Index and its divorce rate in 2025 — essentially none: states with younger marriage ages do not show higher divorce rates.
— Gustavo Athayde analysis of Census ACS 2025, B12007 and Census ACS 2025, B12503 data
- 79.
24.8 marriages per 1,000 residents took place in Nevada in 2024, the highest rate of any state in CDC records, which count weddings where they occur rather than where couples live.
— CDC/NCHS
- 80.
13.4 marriages per 1,000 residents were recorded in Utah in 2024, the second-highest rate in CDC records after Nevada and ahead of Hawaii (12.4).
— CDC/NCHS
- 81.
2.3 divorces per 1,000 people were recorded in 2024 in the 45 states and D.C. that report them, down from 4.0 in 2000 (reporting states differ slightly between years).
— CDC/NCHS
Where weddings take place
- 82.
51.7 women married per 1,000 unmarried women in Utah in 2024, the highest refined marriage rate in the nation for the fifth year in a row, according to NCFMR; the national rate was 31.2.
- 83.
16.6 to 16.7: the ACS marriage rate per 1,000 women held steady between 2012 and 2022, while the divorce rate fell from 9.8 to 7.1, according to the Census Bureau.
- 84.
99.0 marriages per 1,000 residents were recorded in Nevada in 1990, when Las Vegas chapels drew couples from across the country; the state’s rate was 24.8 in 2024 (historical comparison).
— CDC/NCHS
- 85.
About twice as likely: men aged 22 to 29 earning $60,000 or more marry in a given year at around double the rate of their peers, according to the Institute for Family Studies (ACS 2020–2024).
What this means for families: the states that marry youngest also marry most often, and earlier weddings there do not go with higher divorce rates. Wherever a couple begins, a household that keeps its marriage keeps its story — the kind of continuity a family crest is designed to carry from one generation to the next.
Marriage age, lasting marriages and family traditions
Most Americans who marry do so once. Later first marriages are linked with fewer remarriages, and the rituals that couples choose — from vows to cultural traditions — remain central to the American wedding.
Married once
- 86.
76.3% of Americans who have ever married have married only once (2025).
— Gustavo Athayde analysis of Census ACS 2025, B12505 data
- 87.
84.1% of ever-married adults in New Jersey have married only once (2025), the highest share of any state, ahead of Massachusetts (83.7%) and New York (83.6%) — three states near the older end of the ranking.
— Gustavo Athayde analysis of Census ACS 2025, B12505 data
- 88.
0.52 is the 2025 correlation between a state’s Wedding Age Index and the share of its ever-married adults who have married only once — later first marriages tend to go with fewer remarriages.
— Gustavo Athayde analysis of Census ACS 2025, B12007 and Census ACS 2025, B12505 data
- 89.
82.0% of ever-married adults in North Dakota have married only once (2025), the highest share among the 10 youngest-marrying states, followed by Utah (79.7%).
— Gustavo Athayde analysis of Census ACS 2025, B12505 data
Marriage age and lasting marriages
- 90.
68.0% of women and 62.1% of men aged 15 and over had ever married in 2025.
— Gustavo Athayde analysis of Census ACS 2025, B12505 data
- 91.
11%: each additional year of age at first marriage reduced the odds of divorce by 11% up to the early thirties, after which the odds rose by 5% a year, in Nicholas Wolfinger’s analysis of 2006–2010 federal survey data (historical).
- 92.
Just over a third of Americans who married at 21 or younger and attended religious services weekly were divorced by 2018, compared with more than half of those who did not attend, according to the Institute for Family Studies (2026).
- 93.
61% of married adults aged 25 to 50 were thriving in 2023, compared with 45% of those who had never married (Gallup).
— Gallup
Marriage and well-being
- 94.
39% of Americans say it is very important for a couple with a child to marry, up 10 points from 2020; among weekly churchgoers, the share rose from 41% to 65% (Gallup, May 2026).
— Gallup
- 95.
26.5 is the average age Americans say is best to get married, though about half say there is no best age (Pew Research Center survey, April 2024).
- 96.
14 months was the average engagement among couples who married in 2025, after an average of three years of dating (The Knot 2026 Real Weddings Study, 10,474 couples).
- 97.
$34,000 was the average cost of a wedding in 2025, with 117 guests on average (The Knot 2026 Real Weddings Study).
Weddings, engagements and traditions
- 98.
32% of couples who married in 2025 incorporated religious, ethnic or cultural elements into their wedding, and 61% wrote their own vows.
- 99.
31.0 for women and 33.4 for men is the average (mean) age at first marriage across OECD countries in the latest OECD Family Database figures (2021 or latest year); U.S. medians are younger, though the two measures are not directly comparable.
- 100.
More than 6 marriages per 1,000 people: the United States is among the OECD countries with the highest crude marriage rates, against an OECD average of 4.3 (OECD Family Database, 2022 or latest year).
What this means for the atelier’s clients: couples are marrying later, after longer courtships and with more of their own resources, and they are investing in details meant to last — from wedding monograms to a first family emblem. See also our data on wedding costs by state and the most popular wedding dates.
Methodology
The ranking uses the U.S. Census Bureau’s American Community Survey 2025 1-year estimates, table B12007 (median age at first marriage by sex), read from the Census table-based Summary File released in October 2026. The Wedding Age Index is the simple average of the male and female medians; its margin of error is the square root of the sum of the two squared margins, divided by two. All margins are at the 90% confidence level, and two states are described as statistically tied when the difference between them is smaller than the square root of the sum of their squared margins.
Never-married shares come from table B12002, summing the 25–29 and 30–34 age groups; marriage and divorce rates come from tables B12501 and B12503 (women who married or divorced in the past 12 months per 1,000 women aged 15 and over); remarriage shares come from table B12505. Changes since 2021 compare the 2021 and 2025 1-year tables. Correlations are simple Pearson coefficients across the 50 states and are descriptive, not causal.
The historical series (1890–2025) comes from Census table MS-2, based on the Current Population Survey and, before 1947, the decennial census; it differs slightly from the ACS because the two surveys use different samples and methods. CDC marriage rates count weddings by the state where they take place. The District of Columbia is shown but not ranked among the states.
About the author

Gustavo Athayde — Founder & Creative Director, GUSTAVO ATHAYDE
Gustavo Athayde is the founder and creative director of GUSTAVO ATHAYDE, a bespoke monogram atelier based in Sioux Falls, South Dakota. A graphic designer by training, he creates monograms, personal and family crests, heraldic emblems, signet designs and wax seals for individuals, families, couples and brands across the United States. Every commission is refined line by line into a symbol meant to be kept, used and passed down.
Follow the atelier on Instagram · Request a private consultation
Frequently asked questions
- Which state has the youngest age at first marriage?
- Idaho and Utah tie in 2025 with a Wedding Age Index of 26.6, and Arkansas is statistically tied at 26.7. Women in Idaho have the lowest median age at first marriage of any state, 25.5.
- Which state has the oldest age at first marriage?
- Vermont ranks last in 2025 with an index of 31.7, closely followed by Rhode Island, California, New York and Massachusetts; all five are statistically tied with one another. The District of Columbia, which is not ranked, is higher still at 32.2.
- What is the average age of first marriage in the U.S.?
- The Census Bureau’s 2025 American Community Survey puts the median at 30.7 for men and 28.9 for women. Its Current Population Survey gives 30.8 and 28.4 for the same year.
More questions about marriage age
- Why do people in Utah and Idaho marry younger?
- Both states have the youngest populations in the country, high marriage rates and strong religious and family traditions. Their young adults are also the most likely in the nation to be married by their early thirties.
- Is the age at first marriage still rising?
- Nationally, it rose slowly between 2021 and 2025. Several states — including Alabama, Mississippi and West Virginia — now marry younger than in 2021, while Texas, Washington and Oregon marry later.
- Do people who marry younger divorce more?
- Across the states, there is essentially no statistical link between the Wedding Age Index and the divorce rate in 2025. At the individual level, research finds the lowest divorce risk among people who marry in their late twenties to early thirties.
Cite this page
Source: Gustavo Athayde, "Where Americans Marry Youngest and Oldest 2026", https://gustavoathayde.com/age-at-first-marriage-by-state/Feel free to use these statistics and charts — we just ask for a link back to this page.
Sources
- 1 in 3: A Record Share of Young Adults Will Never Marry, Lyman Stone — Institute for Family Studies
- 12th-grade girls are less likely than boys to say they want to get married someday (2025) — Pew Research Center
- A growing share of U.S. husbands and wives are roughly the same age (2024) — Pew Research Center
- A record-high share of 40-year-olds in the U.S. have never been married (2023) — Pew Research Center
- ACS 2021 1-year, Marriages in the Last Year (table B12501) — U.S. Census Bureau
- ACS 2021 1-year, Median Age at First Marriage (table B12007) — U.S. Census Bureau
- Americans More Likely to Say Parents Should Marry (2026) — Gallup
- Best age to get married, have a child, buy a home and retire (2025) — Pew Research Center
- Census Bureau Releases New Estimates on America's Families and Living Arrangements (2025) — U.S. Census Bureau
- Characteristics of U.S. couples, America Counts (2026) — U.S. Census Bureau
- Divorces in the Last Year, ACS 2025 1-year (table B12503) — U.S. Census Bureau
- Estimated Median Age at First Marriage, 1890 to Present (table MS-2) — U.S. Census Bureau
- FP-26-01, Median age at first marriage in the U.S., 2024 — NCFMR, Bowling Green State University
- Geographic variation in median age at first marriage, 2008, FP-09-03 — NCFMR, Bowling Green State University
- Going to Church Can Reduce Your Divorce Risk, Jesse Smith (2026) — Institute for Family Studies
- Mapping Marriage in America: Where Young Adults Marry Most (2026) — Institute for Family Studies
- Marriages in the Last Year, ACS 2025 1-year (table B12501) — U.S. Census Bureau
- Married Americans Thriving at Higher Rates Than Unmarried Adults (2024) — Gallup
More sources
- Median Age at First Marriage by Sex, ACS 2025 1-year (table B12007) — U.S. Census Bureau
- Number of Times Married, ACS 2025 1-year (table B12505) — U.S. Census Bureau
- Provisional number of marriages and marriage rate, 2000–2024 — CDC/NCHS
- Real Weddings Study data read-out, 2026 (PDF) — The Knot
- Sex by Marital Status by Age, ACS 2025 1-year (table B12002) — U.S. Census Bureau
- SF3.1 Marriage and divorce rates — OECD Family Database
- State marriage rates, 1990–2024 — CDC/NCHS
- The Knot Worldwide Unveils 2026 Real Weddings Study — The Knot Worldwide
- Timing of first marriage, Family Profile FP-26-13 — NCFMR, Bowling Green State University
- Trends in marriage and divorce rates, America Counts (2024) — U.S. Census Bureau
- U.S. refined marriage rate, 2024, Family Profile FP-25-30 — NCFMR, Bowling Green State University
- Utah's Marriage Trends (2025) — Kem C. Gardner Policy Institute, University of Utah
- Vintage 2025 population estimates (2026) — U.S. Census Bureau
- Want to Avoid Divorce? Wait to Get Married, But Not Too Long, Nicholas H. Wolfinger — Institute for Family Studies
- Working paper SEHSD-WP2025-03, Hemez and Vespa (2025) — U.S. Census Bureau
- Young adults and the milestones of adulthood, America Counts (2025) — U.S. Census Bureau
- Young adults without children and plans for marriage and parenthood (2024) — Pew Research Center