
100 Elopement and Micro-Wedding Statistics 2026: The Cost of Marrying Small
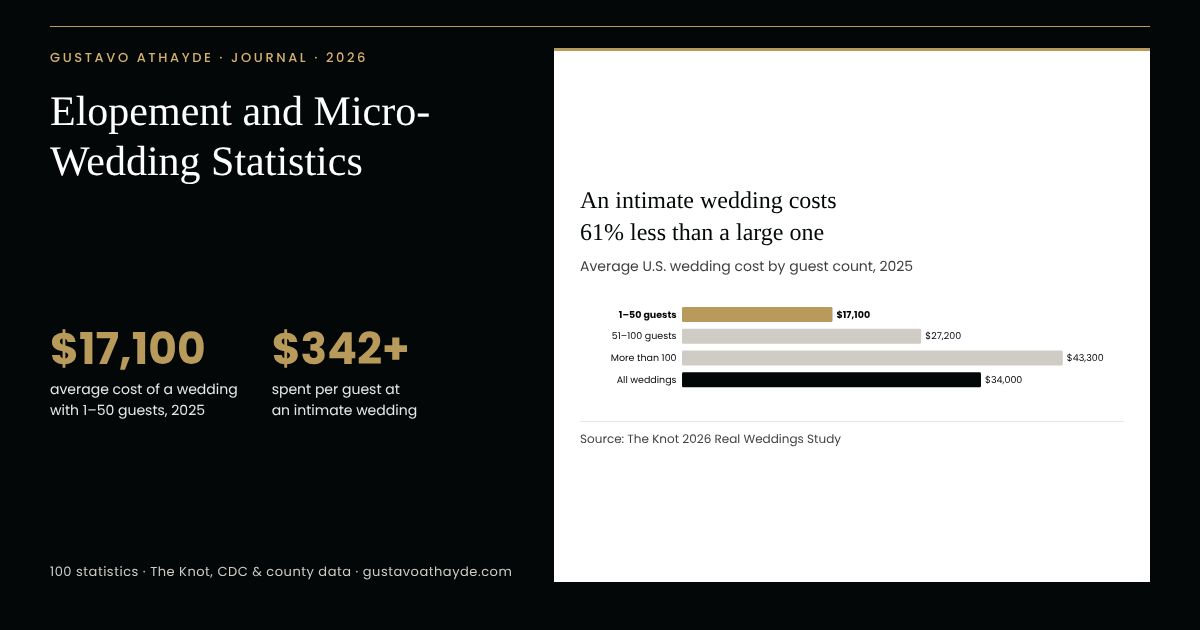
These elopement statistics start with a paradox. The average American wedding of 2025 hosted 117 guests, 14 fewer than in 2019, and a wedding of 50 guests or fewer cost $17,100, less than half the $43,300 of a large celebration. Yet small weddings are not cheaper per person: an intimate wedding spends at least $342 on each guest, above the $292 national average. Couples who marry small are choosing fewer guests, not lower standards.
Below are 100 elopement and micro-wedding statistics for 2026, drawn from the CDC, the Census Bureau, the Bureau of Labor Statistics, county clerks, The Knot, Zola and leading family researchers, with original analysis by the atelier.
At a glance
Key takeaways
- An intimate wedding of up to 50 guests cost $17,100 in 2025, 61% less than a wedding of more than 100 guests.
- Per guest, small weddings cost more: at least $342, against a $292 national average.
- After inflation, the average wedding cost 3.6% less in 2025 than in 2019, while spending per guest rose 8.4%.
- Weddings of 50 guests or fewer made up 18% of U.S. weddings in 2024, up from 10% in 2013.
- Only 3% of couples planning 2025 weddings on Zola said they were eloping.
- A courthouse wedding costs $30 to $177 in official fees in the jurisdictions reviewed.
- 2,128,446 couples married in 2024, 27% more than in 2020.
- Nevada’s marriage rate is 3.9 times the national rate.
- 52% of newlywed homeowners had a smaller wedding to afford a bigger home.
- Weddings with more guests, and lower spending, are associated with longer marriages.
Elopement statistics: how big is the American wedding now?
Guest lists shrank sharply in 2020 and never fully regrew. The share of very small weddings has nearly doubled in a decade, even as true elopements remain a small minority of couples.
- 1.
117 guests attended the average American wedding in 2025, according to The Knot’s survey of 10,474 couples married that year.
— The Knot
- 2.
131 guests was the average in 2019, and guest lists have not returned to that pre-pandemic level as of 2025.
— The Knot
- 3.
141 guests attended the average wedding in 2010.
— The Knot
- 4.
- 5.
Under 50 guests is the threshold The Knot uses for an “intimate” wedding in 2025; more than 100 guests counts as large.
— The Knot
- 6.
18% of U.S. weddings in 2024 had 50 guests or fewer, up from 10% in 2013, according to The Wedding Report data published by Axios.
- 7.
29% fewer guests attended the average wedding in 2024 than in 2006 by The Wedding Report’s count (131 vs. 184).
— Gustavo Athayde analysis of Axios / The Wedding Report data
Planned guest lists among engaged couples
- 8.
3% of couples planning 2025 weddings on Zola answered yes to “Are you eloping?”, among more than 6,000 surveyed.
— Zola
- 9.
6% of Zola couples marrying in 2025 planned a guest list of 50 or fewer (1% at 10–30 guests and 5% at 30–50).
— Zola
- 10.
89% of couples planning 2025 weddings on Zola rated “intimate weddings” as in style.
— Zola
Micro-wedding cost statistics: a small wedding vs. a big wedding
A smaller wedding is far less expensive in total, but it is not cheaper per person. Couples who keep the list short tend to spend more on each guest, which is the counterintuitive finding at the heart of the micro-wedding trend.
- 11.
$34,000 was the average cost of a U.S. wedding in 2025, unchanged from 2024.
— The Knot
- 12.
$17,100 was the average cost of a 2025 wedding with 1 to 50 guests.
— The Knot
- 13.
$27,200 was the average cost of a 2025 wedding with 51 to 100 guests.
— The Knot
- 14.
$43,300 was the average cost of a 2025 wedding with more than 100 guests.
— The Knot
- 15.
$26,200 less, or 61% less, is what an intimate wedding of up to 50 guests cost in 2025 compared with a wedding of more than 100.
— Gustavo Athayde analysis of The Knot data
- 16.
- 17.
$292 per guest was the average spend at 2025 weddings, up $8 from 2024.
— The Knot
SHARE THIS CHART
Copy the code below to embed this chart on your site:
Cost per guest, before and after inflation
- 18.
$214 per guest was the average spend in 2019, before the pandemic.
— The Knot
- 19.
8% more per guest after inflation: spending per guest rose 36% from 2019 to 2025 in current dollars and 8.4% after adjusting for consumer prices.
— Gustavo Athayde analysis of The Knot and The Knot and Bureau of Labor Statistics data
- 20.
3.6% less in real terms is what the average 2025 wedding cost compared with 2019: $28,000 then equals about $35,300 in 2025 dollars, against $34,000 spent in 2025.
— Gustavo Athayde analysis of The Knot and Bureau of Labor Statistics data
- 21.
$15,000 vs. $42,000: weddings of 50 guests or fewer cost an average of $15,000 in 2024, against $42,000 for weddings of more than 100.
— The Knot
Small and large weddings over time
- 22.
$15,000 vs. $38,000 was the gap in 2021 in day-of (ceremony and reception) cost between weddings of fewer than 50 guests and those of more than 100.
— The Knot
- 23.
- 24.
$18,231 was the median U.S. wedding cost in 2025, against an average of $32,899 across 2,011,044 weddings, by The Wedding Report’s estimate.
- 25.
55% of the average: the median 2025 wedding cost just over half the average, a sign that a minority of large weddings lifts the headline figure.
— Gustavo Athayde analysis of The Wedding Report data
Average wedding cost by guest count
Guest count 2021 2024 2025 Per guest, 2025* Up to 50 guests $15,000 $15,000 $17,100 at least $342 51–100 guests — — $27,200 $272–$533 More than 100 guests $38,000 $42,000 $43,300 at most $433 All weddings $28,000 $33,000 $34,000 $292
*Gustavo Athayde analysis: bucket cost divided by the largest and smallest possible guest count in each bucket; the national figure is The Knot’s reported average. 2021 buckets are “under 50” and “over 100.” Source: The Knot Real Weddings Studies.
What this means for couples. The guest list is the single largest lever on a wedding budget, yet a short list invites a higher standard for each person present. Many couples who marry small redirect the savings into lasting things: a home, a honeymoon, or keepsakes such as a wedding monogram that appears on the invitation and remains with the family afterward.
Courthouse wedding and civil ceremony statistics
The legal part of a wedding remains remarkably affordable. In several jurisdictions, couples may even marry themselves, a tradition with deep roots in American Quaker practice.
- 26.
4.53% of couples planning 2025 weddings on Zola chose a courthouse ceremony.
— Zola
- 27.
2.95% of Zola couples marrying in 2024 planned an elopement event, and 4.65% a courthouse ceremony, among nearly 7,000 surveyed.
— Zola
- 28.
$35 is the fee for a marriage license from the New York City Clerk in 2026.
— NYC311
- 29.
$60 in official fees covers a City Hall wedding in New York in 2026 ($35 license plus a $25 ceremony at the City Clerk’s office), or about 0.2% of the average wedding.
— Gustavo Athayde analysis of NYC311 and NYC Tourism and The Knot data
- 30.
$102 is the Clark County (Las Vegas) marriage license fee in 2026, with no waiting period after issue.
- 31.
$177 in county fees covers a complete courthouse wedding in Las Vegas in 2026: the $102 license plus a $75 civil ceremony at the Clerk’s office.
— Gustavo Athayde analysis of Clark County Clerk data
- 32.
$60 is the marriage license fee in Cook County, Illinois (Chicago), in 2026.
Marriage license and ceremony fees by jurisdiction
Jurisdiction License Civil ceremony Self-uniting allowed Clark County, Nev. (Las Vegas) $102 $75 No New York City $35 $25 No Cook County, Ill. $60 — No Philadelphia, Pa. $90 ($100 self-uniting) — Yes Washington, D.C. $45 — Yes (one partner officiates) Larimer County, Colo. $30 — Yes (no officiant or witnesses)
Fees as published by each clerk in 2026; the New York ceremony fee is from NYC Tourism + Conventions. “—” means no civil ceremony fee is listed on the clerk’s page.
- 33.
$45 is the marriage license fee in Washington, D.C., in 2026, where one of the partners may perform the ceremony.
- 34.
$30 is the marriage license fee in Larimer County, Colorado, in 2026; Colorado couples may solemnize their own marriage, and no witnesses are required.
- 35.
$100 buys a Quaker or self-uniting marriage license in Philadelphia in 2026, against $90 for a regular license.
- 36.
About 7,000 weddings a year take place at San Francisco City Hall, according to a July 2026 Fox News report citing the Los Angeles Times.
- 37.
190% was the rise in Pinterest searches for “city hall elopement” in the platform’s 2025 wedding trends report (Pinterest search data; the report does not give a comparison period).
- 38.
637% was the rise in Pinterest searches for “civil ceremony photography,” and 137% for “courthouse wedding dress ideas,” in the 2025 report (Pinterest search data; no comparison period given).
Destination elopements: Las Vegas, Hawaii and the national parks
Elopements cluster in a handful of places. Because the CDC counts marriages where they happen, destination states post rates far above the places couples call home.
- 39.
76,779 marriage licenses were issued in Clark County, Nevada, in 2024, and the Clerk performed 4,577 civil ceremonies.
- 40.
1,625,034 wedding visitors came to Las Vegas in 2023, generating $2.2 billion in economic activity.
- 41.
3.84% of all U.S. weddings took place in Clark County in 2022.
- 42.
24.8 marriages per 1,000 people made Nevada the leading state in 2024, counted by state of occurrence.
— CDC/NCHS
- 43.
- 44.
12.4 marriages per 1,000 people in Hawaii in 2024, the third-highest rate, reflects its standing as a destination for couples from elsewhere.
— CDC/NCHS
Highest marriage rates by state
Rank State 2024 2023 1 Nevada 24.8 25.9 2 Utah 13.4 9.9 3 Hawaii 12.4 14.4 — District of Columbia 10.1 8.3 4 Montana 9.2 9.9 5 Colorado 8.1 7.5 6 Arkansas 7.9 7.9 7 Tennessee 7.6 7.3 7 Wyoming 7.6 7.3 9 Vermont 7.4 7.8 — United States 6.3 6.1
Marriages per 1,000 residents by state of occurrence; provisional. Source: CDC/NCHS.
- 45.
9.2 per 1,000 in Montana and 8.1 in Colorado in 2024 placed both mountain states among the top five for marriage rates.
— CDC/NCHS
- 46.
60 ceremonies a year is the cap at each large, site-specific wedding location in Grand Teton National Park, and all of those locations are fully booked for 2026.
- 47.
$5,000 to $10,000 is the typical cost of an elopement as of 2025, according to an estimate by The Knot’s experts (not a survey).
— The Knot
What this means for elopements. A wedding far from home is easy to keep small, yet it leaves fewer shared memories with family. Couples who elope often send announcements afterward; a personal couple monogram or wax seal gives that note the weight of a formal invitation.
The pandemic “minimony” and its legacy
The year 2020 forced an experiment in small weddings at national scale. Some of its habits have faded, while others have endured.
- 48.
66 guests attended the average wedding in 2020, half the 131 of 2019.
— The Knot
- 49.
$19,000 was the average wedding cost in 2020, against $28,000 in 2019.
— The Knot
- 50.
42% of couples who held a ceremony in 2020 had a “minimony,” a small ceremony ahead of a later celebration.
— The Knot
- 51.
80% of couples who changed their 2020 wedding plans downsized their guest lists.
— The Knot
- 52.
32% of 2020 couples moved their reception, and 15% their entire wedding, to 2021 or later.
— The Knot
- 53.
56% of U.S. couples surveyed in fall 2020 were marrying legally before a rescheduled reception, with the U.S. and Chile the most likely of the countries surveyed to do so.
- 54.
105 guests attended the average wedding in 2021, as celebrations began to grow again.
— The Knot
- 55.
4 in 10 couples marrying in 2026 are changing plans because of the economy, and guest lists are being trimmed by an average of 29 people, in an October 2025 survey of 600 engaged couples.
Marriage statistics behind every ceremony
Whatever their size, weddings rest on a steady institution. More Americans are marrying than at any point since 2018, and the ratio of marriages to divorces is the strongest in years.
- 56.
2,128,446 marriages took place in the United States in 2024, a rate of 6.3 per 1,000 people, according to provisional CDC data.
— CDC/NCHS
- 57.
4.2% more couples married in 2024 than in 2023 (2,041,926).
— Gustavo Athayde analysis of CDC/NCHS data
- 58.
27% more marriages took place in 2024 than in the pandemic low of 2020 (1,676,911).
— Gustavo Athayde analysis of CDC/NCHS data
- 59.
8.1% fewer marriages took place in 2024 than in 2000 (2,315,000), while the population grew by more than 58 million.
— Gustavo Athayde analysis of CDC/NCHS data
- 60.
6.3 per 1,000 in 2024 is the highest U.S. marriage rate since 2018, when it stood at 6.5.
— CDC/NCHS
Divorce, age at marriage and households
- 61.
2.3 divorces per 1,000 people were recorded in 2024 in reporting states, down from 4.0 in 2000.
— CDC/NCHS
- 62.
2.42 marriages for every divorce took place in 2024, the highest marriage-to-divorce ratio in the recent ACS series.
- 63.
30.8 for men and 28.4 for women was the median age at first marriage in 2025.
- 64.
47% of U.S. households were married-couple households in 2025.
- 65.
13.4 marriages per 1,000 people in Utah in 2024, up from 9.9 in 2023, gave it the second-highest rate.
— CDC/NCHS
- 66.
6.2 marriages per 1,000 people were recorded in South Dakota in 2024, close to the national rate.
— CDC/NCHS
Wedding debt, thrift and who pays
Couples now carry most of the cost themselves, and many weigh the wedding against a down payment. Families still play a central role in helping them.
- 67.
67% of newlyweds went into debt to pay for their wedding, in a 2025 LendingTree survey of 1,050 newlyweds.
- 68.
64% of those who borrowed had already paid off their wedding debt in 2025.
- 69.
26% of newlyweds wish they had spent less on the wedding, and an equal 26% wish they had spent more (2025).
- 70.
$6,260 was the average honeymoon cost among newlyweds surveyed in 2025, their single largest wedding expense.
- 71.
52% of newlywed homeowners say they had a smaller wedding to afford a bigger home, in a 2025 LendingTree survey.
- 72.
59% of newlywed homeowners who made a down payment spent more on it than on their wedding (2025).
Who pays for the wedding
- 73.
88% of couples marrying in 2026 are paying for at least part of their own wedding: 29% in full and 59% in part.
— Zola
- 74.
69% of 2026 weddings that receive outside help are supported by both families.
— Zola
- 75.
51% of 2026 couples saved for years before getting engaged, and only 4% have taken out a loan for the wedding.
— Zola
- 76.
44% of 2026 couples have already adjusted their plans to avoid rising costs.
— Zola
What this means for families. A modest wedding paired with a home or savings is a choice many couples make on their own terms. Families who want to mark the occasion often prefer a gift that lasts, such as a family crest for the new household.
What Americans want from a wedding
Opinion favors restraint. Younger Americans picture smaller weddings, yet nearly all of them still want to marry.
- 77.
66% of Americans say couples spend too much on weddings, rising to 86% among those 65 and older, in a 2023 YouGov poll of 1,000 adults.
— YouGov
- 78.
47% of Americans say the couple should pay the largest share of the wedding, against 20% who name the bride’s parents (2023).
— YouGov
- 79.
40% of unmarried Gen Z adults say their dream wedding is smaller and more intimate, against 19% who picture a large traditional one, in a 2026 survey of 2,000.
- 80.
Only 10% of unmarried Gen Z adults say they do not want to marry or have a wedding (2026).
- 81.
75% of Gen Z adults say wedding culture pressures them to spend money they do not want to spend (2026).
Couples, guests and second thoughts
- 82.
85% of couples marrying in 2026 say their wedding will be worth every penny.
— Zola
- 83.
67% of adults aged 18 to 44 who recently attended or plan to attend a wedding have noticed a rise in micro-weddings of 50 guests or fewer, in a 2025 Credit Karma survey of 1,106.
- 84.
54% of micro-wedding guests surveyed said they had spent more to attend a micro-wedding than a traditional one (2025).
- 85.
21% of Americans who have ever been married said they would elope if they could do it again, and 32% would spend less, in a January 2018 AP-NORC poll of 1,234 adults (historical).
— AP-NORC
Wedding prices in 2026: what is driving the cost of a smaller wedding
Destination elopements lean on travel and lodging, two of the fastest-rising prices in the economy this year.
- 86.
3.7% was the rise in overall U.S. consumer prices in the 12 months to September 2026.
- 87.
22.4% was the rise in airline fares in the 12 months to September 2026, the steepest increase among wedding-related prices.
- 88.
4.4% was the rise in the price of lodging away from home over the same 12 months (2026).
- 89.
3.8% was the rise in prices at full-service restaurants in the 12 months to September 2026, against 3.5% for all food away from home.
- 90.
11.8% was the rise in jewelry prices in the 12 months to September 2026.
- 91.
2.9% was the rise in prices for photographers and photo processing over the same period (2026).
- 92.
−4.2%: women’s dresses were the only wedding-related category in this list to fall in price in the 12 months to September 2026.
Wedding-related price changes
Category 12-month change to Sept. 2026 Airline fares +22.4% Jewelry +11.8% Lodging away from home +4.4% Full-service meals +3.8% All items +3.7% Food away from home +3.5% Photographers and photo processing +2.9% Women’s dresses −4.2%
Consumer Price Index for All Urban Consumers, not seasonally adjusted. Source: U.S. Bureau of Labor Statistics.
Wedding size, marriage and family: what the research shows
Research on wedding spending and marriage outcomes points in a clear direction: spend modestly, but gather the people who matter. These studies show associations, not causes.
- 93.
1.6 times the hazard of divorce was associated with weddings costing $20,000 or more, compared with $5,000 to $10,000, among women, in a study of 3,151 ever-married Americans surveyed in 2014.
- 94.
Half the hazard of divorce was associated with spending less than $1,000 on the wedding, compared with $5,000 to $10,000, among men in the same 2014 study.
- 95.
About half the hazard of divorce was associated with weddings of 200 or more guests, compared with couples who married with no guests, in the same 2014 data (hazard ratio 0.480).
- 96.
A lower hazard of divorce was associated with having a honeymoon, whatever it cost, in the 2014 data.
- 97.
47% of couples with 150 or more wedding guests reported high marital quality, against 31% of those with 50 or fewer, in the National Marriage Project’s 2014 Before “I Do” report.
Marriage, happiness and faith
- 98.
86% of married men and 87% of married women say they are happy with their lives, against 66% and 69% of single men and women (2025).
- 99.
60% of married Americans 65 and older were married by a religious leader in a religious setting, against 36% of those aged 18 to 34, in a 2019 survey (historical).
- 100.
32% of couples married in 2025 included religious, ethnic or cultural elements in their wedding.
— The Knot
What this means for couples. The research supports a wedding that is modest in cost and rich in witnesses: friends and family who will support the marriage for decades. A symbol made to be kept and passed down serves that purpose long after the day itself.
Methodology
Each statistic comes from the source linked beside it and carries the year of the underlying data. Industry surveys (The Knot, Zola, LendingTree and others) are self-reported and not nationally representative; we name the sample where the source provides it. The Knot reports what couples spent after the wedding, while Zola reports planned budgets, which explains why Zola’s averages ($36,000 and 145 guests for 2026) run higher.
Items marked ATELIER ANALYSIS are our calculations from public data. Cost per guest for each size group divides the group’s average cost by the largest or smallest possible guest count, so it is a bound, not an average. The Knot’s 2021 size groups (“under 50” and “over 100”) reflect day-of costs and differ slightly from its 2025 groups, so the 2021–2025 comparison is approximate. Inflation adjustments use the CPI-U annual averages for 2019 (255.657) and 2025 (321.943) from the Bureau of Labor Statistics. CDC marriage counts are provisional and recorded by state of occurrence. Comparisons are descriptive, not causal.
About the author

Gustavo Athayde — Founder & Creative Director, GUSTAVO ATHAYDE
Gustavo Athayde is the founder and creative director of GUSTAVO ATHAYDE, a bespoke monogram atelier based in Sioux Falls, South Dakota. A graphic designer by training, he creates monograms, personal and family crests, heraldic emblems, signet designs and wax seals for individuals, families, couples and brands across the United States. Every commission is refined line by line into a symbol meant to be kept, used and passed down.
Follow the atelier on Instagram · Request a private consultation
Frequently asked questions
- How many couples elope in the United States?
- No official count exists. Among couples planning 2025 weddings on Zola, 3% said they were eloping, while 18% of all U.S. weddings in 2024 had 50 guests or fewer, according to The Wedding Report.
- How much does a micro-wedding cost?
- A wedding of 1 to 50 guests cost an average of $17,100 in 2025, according to The Knot, compared with $43,300 for more than 100 guests.
- Is a smaller wedding cheaper per guest?
- Usually not. An intimate wedding spends at least $342 per guest, by our analysis of The Knot data, above the $292 national average.
More questions about small weddings
- What does a courthouse wedding cost?
- Official fees range from $30 for a license in Larimer County, Colorado, to $177 for a license and civil ceremony in Las Vegas in 2026.
- Where do the most people get married?
- Nevada had the highest marriage rate in 2024, at 24.8 per 1,000 people, followed by Utah and Hawaii, according to the CDC.
- Does wedding size affect marriage success?
- Studies find associations, not causes: lower wedding spending and more guests are both linked to longer or happier marriages in the research reviewed here.
Cite this page
Source: Gustavo Athayde, "Elopement and Micro-Wedding Statistics 2026", https://gustavoathayde.com/elopement-micro-wedding-statistics/Feel free to use these statistics and charts — we just ask for a link back to this page.
Sources
- CDC/NCHS, Marriage Rates by State 1990–2024
- CDC/NCHS, National Marriage and Divorce Rates 2000–2024
- City of Philadelphia, Get a Marriage License
- Clark County Clerk, Fees
- Clark County, Clerk Performance Measures
- Cook County Clerk, Marriage Licenses
- D.C. Superior Court, Marriage License
- How to Get Married in Las Vegas (Clark County Clerk)
- Larimer County Clerk, Marriage
- National Park Service, Grand Teton Wedding Commitments
- New York City Tourism + Conventions, Weddings
- NYC311, Marriage License
- U.S. Bureau of Labor Statistics, CPI September 2026
- U.S. Bureau of Labor Statistics, CPI-U annual averages (cu.data.1.AllItems)
- U.S. Census Bureau, Families and Living Arrangements 2025
Wedding industry studies
- 2019 Real Weddings Study (The Knot)
- 2020 Real Weddings Study (The Knot)
- 2021 Real Weddings Study, full results (The Knot)
- 2021 Real Weddings Study, press release (The Knot)
- 2026 Real Weddings Study (The Knot, via Business Wire)
- Average Wedding Cost (The Knot)
- First Look Report 2025, Data Deep Dive (Zola)
- Future of Marriage: 2026 Trends to Watch (The Knot Worldwide)
- Global COVID Weddings Report (The Knot Worldwide)
- Guest List Size (The Knot)
- How Much Does It Cost to Elope (The Knot)
- Las Vegas Wedding Tourism Fun Facts (weddings.vegas)
- Pinterest, Annual Wedding Trends Report
- The First Look Report 2026 (Zola)
- United States Wedding Statistics (The Wedding Report)
- Weddings in 2024 (The Knot)
- Zola First Look Report 2024, Data Deep Dive
Research, surveys and press
- AP-NORC and WE tv, Wedding Poll
- Axios, Small weddings (The Wedding Report data)
- Credit Karma, Weddings Are Getting Smaller, Farther and Pricier
- Fox News (Los Angeles Times report), Courthouse weddings
- Francis-Tan and Mialon, Economic Inquiry (RePEc)
- Francis-Tan and Mialon, Wedding Expenses and Marriage Duration (working paper)
- LendingTree, Newlywed Homeowners Survey
- LendingTree, Newlywed Wedding Debt Survey
- NCFMR, Bowling Green State University, Marriage-to-Divorce Ratio 2024
- Survey Center on American Life (AEI), Much Ado About Marriage
- Survey Center on American Life (AEI), The Decline of Religion in American Family Life
- Talker Research, How Gen Z Is Pushing Back on Modern Wedding Culture
- University of Virginia, National Marriage Project, Before "I Do"
- YouGov, Surveying Americans on Wedding Etiquette