
The States Where Marriages Last the Longest 2026: 100 Marriage Statistics
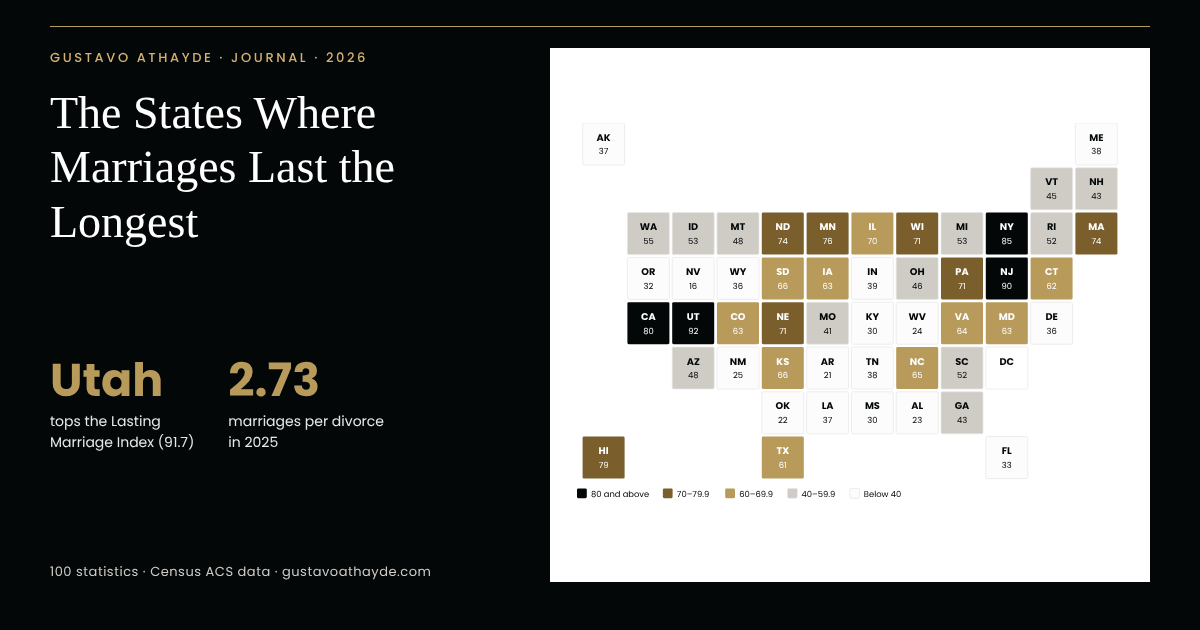
Where do marriages last the longest in America? In Utah, which tops the Gustavo Athayde Lasting Marriage Index, a new state ranking built from Census Bureau data on marriages, divorces and how many times people have married. New Jersey, New York and Hawaii are statistically tied with it.
The national picture is equally encouraging. Americans who married in 2025 outnumbered those who divorced by 2.73 to 1, up from 2.27 in 2021, and 76.3% of ever-married adults have married only once. Below are 100 statistics on the states where marriages last the longest, how long American marriages endure and what helps them last.
At a glance
Key takeaways
- Utah ranks first on the Lasting Marriage Index; New Jersey, New York and Hawaii are statistically tied with it.
- California is the only other state to score 80 or higher.
- Marriages outnumbered divorces 2.73 to 1 in 2025, a 20% rise since 2021.
- Among women, 2.52 marriages per divorce in 2025 is the widest margin in the ACS record, which began in 2008.
- 76.3% of ever-married Americans have married only once; New Jersey leads at 84.1%.
- The divorce rate has fallen 42.5% since 2000, to 2.3 per 1,000 people in 2024.
- The median current marriage has lasted 19 years; 41% of married Americans have passed their 25th anniversary.
- South Dakota has the highest share of 50-year marriages among adults 70 and older, at 58.2%.
- Regular churchgoers are 30% to 50% less likely to divorce.
- Americans planned a record $29.1 billion for Valentine’s Day 2026, $7 billion of it on jewelry.
The Lasting Marriage Index: where marriages last the longest
The index scores every state from 0 to 100 on three measures of durable marriage drawn from the Census Bureau’s American Community Survey: how many people married for every person who divorced over 2023–2025, the share of ever-married adults who have married only once, and the share who are currently divorced. Each measure carries equal weight.
The map: how every state scores
SHARE THIS CHART
Copy the code below to embed this chart on your site:
What the ranking shows
- 1.
Utah ranks first on the Lasting Marriage Index with a score of 91.7 out of 100, combining the nation’s highest ratio of marriages to divorces (2023–2025), the lowest share of ever-married adults who are currently divorced (2025) and a first-marriage share above the national figure.
— Gustavo Athayde analysis of U.S. Census Bureau, ACS 1-year tables B12501, B12503, B12505 and B12001 data
- 2.
New Jersey (90.0), New York (85.2) and Hawaii (79.4) are statistically tied with Utah once the survey’s margins of error are taken into account (2023–2025 data).
— Gustavo Athayde analysis of U.S. Census Bureau, ACS 1-year tables B12501, B12503, B12505 and B12001 data
- 3.
California places fourth with a score of 80.5, making it one of only four states to score 80 or higher (2023–2025).
— Gustavo Athayde analysis of U.S. Census Bureau, ACS 1-year tables B12501, B12503, B12505 and B12001 data
- 4.
Minnesota (75.9), North Dakota (74.0) and Massachusetts (73.6) round out the top eight, each pairing a high first-marriage share with a below-average share of divorced adults (2023–2025).
— Gustavo Athayde analysis of U.S. Census Bureau, ACS 1-year tables B12501, B12503, B12505 and B12001 data
- 5.
Five of the 12 highest-scoring states are in the Midwest (Minnesota, North Dakota, Wisconsin, Nebraska and Illinois), and four are in the Northeast (2023–2025).
— Gustavo Athayde analysis of U.S. Census Bureau, ACS 1-year tables B12501, B12503, B12505 and B12001 data
The national benchmark, the wedding capital and the regions
- 6.
South Dakota, home of the atelier, ranks 13th with a score of 66.1 and records 2.91 marriages for every divorce over 2023–2025, above the national 2.63.
— Gustavo Athayde analysis of U.S. Census Bureau, ACS 1-year tables B12501, B12503, B12505 and B12001 data
- 7.
The United States as a whole scores 57.7 on the index, and 21 states score above that national benchmark (2023–2025).
— Gustavo Athayde analysis of U.S. Census Bureau, ACS 1-year tables B12501, B12503, B12505 and B12001 data
- 8.
Nevada ranks 50th on the index (16.3), yet it remains America’s wedding capital, with 24.8 marriages per 1,000 residents recorded in 2024, the highest rate of any state, because marriages are counted where they take place and many couples travel to Nevada to marry.
— Gustavo Athayde analysis of U.S. Census Bureau, ACS 1-year tables B12501, B12503, B12505 and B12001, CDC/NCHS, marriage rates by state data
- 9.
Washington, D.C., which is shown but not ranked, records 4.33 marriages per divorce over 2023–2025, the highest ratio of any jurisdiction, and 84.0% of its ever-married residents have married only once (2025).
— Gustavo Athayde analysis of U.S. Census Bureau, ACS 1-year tables B12501, B12503, B12505 and B12001 data
- 10.
The Northeast posts the strongest regional profile: 82.0% of ever-married adults have married only once and 14.5% are currently divorced, compared with 76.3% and 15.7% nationally (2025).
— Gustavo Athayde analysis of U.S. Census Bureau, ACS 1-year tables B12501, B12503, B12505 and B12001 data
Full ranking: states 1–25
Rank State Index (±MOE) Marriages per divorce Married only once Currently divorced 1 Utah 91.7 ±7.2 3.27 79.7% 12.5% 2 New Jersey 90.0 ±4.5 2.95 84.1% 13.1% 3 New York 85.2 ±3.1 2.97 83.6% 14.2% 4 California 80.5 ±2.2 2.87 81.8% 14.0% 5 Hawaii 79.4 ±10.7 3.09 80.6% 14.9% 6 Minnesota 75.9 ±4.6 2.65 82.2% 14.0% 7 North Dakota 74.0 ±12.2 2.50 82.0% 13.6% 8 Massachusetts 73.6 ±4.7 2.52 83.7% 14.6% 9 Wisconsin 71.0 ±5.0 2.95 79.3% 15.5% 10 Pennsylvania 70.9 ±3.3 2.70 79.7% 14.4% 11 Nebraska 70.7 ±7.5 2.70 78.7% 14.0% 12 Illinois 69.8 ±3.6 2.75 80.4% 15.2% 13 South Dakota 66.1 ±12.8 2.91 77.1% 15.5% 14 Kansas 66.0 ±7.5 3.22 74.1% 15.8% 15 North Carolina 64.6 ±4.1 2.97 74.1% 14.8% 16 Virginia 64.0 ±3.8 2.62 76.7% 14.3% 17 Iowa 63.3 ±6.0 2.69 77.6% 15.2% 18 Colorado 63.0 ±5.0 2.69 77.8% 15.4% 18 Maryland 63.0 ±4.9 2.48 79.2% 14.9% 20 Connecticut 62.3 ±6.4 2.55 81.0% 16.2% 21 Texas 61.4 ±2.5 2.76 75.2% 14.9% 22 Washington 55.4 ±4.1 2.70 76.3% 16.5% 23 Michigan 53.5 ±3.5 2.66 76.6% 16.9% 24 Idaho 53.4 ±7.7 2.83 71.6% 15.7% 25 Rhode Island 52.3 ±11.3 2.33 79.6% 16.8%
Full ranking: states 26–38
Rank State Index (±MOE) Marriages per divorce Married only once Currently divorced 26 South Carolina 51.6 ±5.4 2.61 72.2% 15.2% 27 Arizona 48.3 ±4.9 2.81 72.4% 17.1% 27 Montana 48.3 ±10.2 2.69 72.9% 16.7% 29 Ohio 46.3 ±3.3 2.54 74.9% 17.2% 30 Vermont 44.6 ±12.2 2.40 77.2% 18.0% 31 Georgia 42.8 ±3.5 2.46 73.0% 16.8% 31 New Hampshire 42.8 ±8.3 2.16 76.1% 16.6% 33 Missouri 41.3 ±4.3 2.46 72.4% 16.9% 34 Indiana 39.4 ±4.1 2.53 71.9% 17.5% 35 Tennessee 38.1 ±4.1 2.50 69.0% 16.4% 36 Maine 37.7 ±8.5 2.22 74.7% 17.5% 37 Alaska 37.4 ±10.3 2.07 75.8% 17.3% 37 Louisiana 37.4 ±5.3 2.33 72.3% 17.1%
Full ranking: states 39–50, D.C. and Puerto Rico
Rank State Index (±MOE) Marriages per divorce Married only once Currently divorced 39 Wyoming 36.5 ±12.3 2.37 69.9% 16.5% 40 Delaware 35.6 ±9.5 1.77 75.2% 15.9% 41 Florida 33.4 ±2.5 2.34 70.4% 17.3% 42 Oregon 32.4 ±5.1 2.34 72.6% 18.5% 43 Kentucky 30.5 ±4.4 2.35 69.5% 17.6% 43 Mississippi 30.5 ±6.1 2.15 69.1% 16.4% 45 New Mexico 25.0 ±8.1 2.25 73.9% 20.4% 46 West Virginia 23.9 ±6.8 2.16 69.8% 18.3% 47 Alabama 23.0 ±4.3 2.09 68.2% 17.4% 48 Oklahoma 22.2 ±3.7 2.16 67.7% 17.7% 49 Arkansas 21.2 ±5.5 2.17 66.4% 17.4% 50 Nevada 16.3 ±5.4 1.99 70.2% 19.4% — District of Columbia (not ranked) n/a 4.33 84.0% 18.0% — Puerto Rico (not ranked) 2.7 1.41 80.7% 24.2% — United States 57.7 2.63 76.3% 15.7%
Index: average of three measures scaled 0–100 across the 50 states. Marriages per divorce: people who married in the past year per person who divorced, 2023–2025 combined. Married only once and currently divorced: shares of ever-married adults aged 15+, 2025. States with the same displayed score share a rank. New Jersey, New York and Hawaii are statistically tied with Utah. D.C. and Puerto Rico are shown for reference and not ranked; D.C.’s index is not shown because its values fall outside the state range. Source: U.S. Census Bureau, ACS 1-year; Gustavo Athayde analysis.
What this means for couples. The states at the top share a pattern, not a formula: couples who marry and stay married the first time. For those beginning that story, a couple’s monogram designed to grow with the marriage is a quiet way to mark it.
Marriages per divorce: the widest margin on record
The simplest test of whether marriages are holding is to count how many begin for every one that ends. On that measure, the country has been moving in one direction since 2021.
The national picture
- 11.
Americans who married in the past year outnumbered those who divorced by 2.63 to 1 over 2023–2025, counting men and women together.
— Gustavo Athayde analysis of U.S. Census Bureau, ACS 1-year tables B12501, B12503, B12505 and B12001 data
- 12.
In 2025 alone the ratio reached 2.73 marriages per divorce, up from 2.27 in 2021, a rise of 20% in four years.
— Gustavo Athayde analysis of U.S. Census Bureau, ACS 1-year tables B12501, B12503, B12505 and B12001 data
- 13.
Among women, there were 2.52 marriages for every divorce in 2025, above the 2.42 of 2024 that researchers at Bowling Green State University described as the largest ratio since the Census Bureau began collecting the data in 2008.
— Gustavo Athayde analysis of U.S. Census Bureau, ACS 1-year tables B12501, B12503, B12505 and B12001, NCFMR, Bowling Green State University data
- 14.
Washington, D.C. (3.77), Idaho (3.48), Utah (3.21), Kansas (3.13) and New Jersey (3.04) had the highest marriage-to-divorce ratios among women in 2024.
- 15.
Pooling 2023–2025, Utah (3.27), Kansas (3.22) and Hawaii (3.09) are the only states with three or more marriages for every divorce.
— Gustavo Athayde analysis of U.S. Census Bureau, ACS 1-year tables B12501, B12503, B12505 and B12001 data
States, counts and vital records
- 16.
28 of the 50 states record at least 2.5 marriages per divorce over 2023–2025.
— Gustavo Athayde analysis of U.S. Census Bureau, ACS 1-year tables B12501, B12503, B12505 and B12001 data
- 17.
Delaware has the lowest pooled ratio, at 1.77 marriages per divorce (2023–2025), even as more than three in four of its ever-married adults have married only once (75.2%).
— Gustavo Athayde analysis of U.S. Census Bureau, ACS 1-year tables B12501, B12503, B12505 and B12001 data
- 18.
About 4.88 million Americans aged 15 and older married in the 12 months before the 2025 survey, compared with 1.79 million who divorced.
— Gustavo Athayde analysis of U.S. Census Bureau, ACS 1-year tables B12501, B12503, B12505 and B12001 data
- 19.
The number of Americans divorcing in a year fell 2.3% between 2021 and 2025, while the number marrying rose 17.3%.
— Gustavo Athayde analysis of U.S. Census Bureau, ACS 1-year tables B12501, B12503, B12505 and B12001 data
- 20.
960,428 women divorced in the year before the 2025 survey, down from 986,810 in 2024.
— Gustavo Athayde analysis of U.S. Census Bureau, ACS table B12503, NCFMR, Bowling Green State University data
- 21.
Official vital records counted 2,128,446 marriages and 662,950 divorces and annulments in 2024, although five states (California, Hawaii, Indiana, Minnesota and New Mexico) do not report divorce counts.
The trend since 2021
Marriages and divorces in the past year, 2021–2025
Year Married in past year Divorced in past year Ratio (all) Ratio (women) 2021 4,164,172 1,831,717 2.27 2.16 2022 4,742,111 1,878,430 2.52 2.35 2023 4,806,662 1,867,021 2.57 2.38 2024 4,827,649 1,868,585 2.58 2.42 2025 4,884,023 1,789,461 2.73 2.52
People aged 15 and older. Source: U.S. Census Bureau, ACS 1-year, tables B12501 and B12503; Gustavo Athayde analysis.
First marriages that endure
A ratio captures a single year. The share of people who have married only once captures a lifetime, and it is one of the steadiest signals in the data.
Married once, by state
- 22.
76.3% of Americans aged 15 and older who have ever married have married only once, about 140.8 million people (2025).
— Gustavo Athayde analysis of U.S. Census Bureau, ACS 1-year tables B12501, B12503, B12505 and B12001 data
- 23.
18.6% of ever-married Americans have married twice and 5.1%, or 9.4 million people, have married three or more times (2025).
— Gustavo Athayde analysis of U.S. Census Bureau, ACS 1-year tables B12501, B12503, B12505 and B12001 data
- 24.
New Jersey (84.1%), Massachusetts (83.7%) and New York (83.6%) have the highest shares of ever-married adults who have married only once (2025).
— Gustavo Athayde analysis of U.S. Census Bureau, ACS 1-year tables B12501, B12503, B12505 and B12001 data
- 25.
Minnesota (82.2%), North Dakota (82.0%) and California (81.8%) follow, all more than five points above the national share (2025).
— Gustavo Athayde analysis of U.S. Census Bureau, ACS 1-year tables B12501, B12503, B12505 and B12001 data
- 26.
Arkansas has the lowest first-marriage share (66.4%) in 2025, while also recording a marriage rate of 7.9 per 1,000 residents in 2024, well above the national 6.3.
— Gustavo Athayde analysis of U.S. Census Bureau, ACS 1-year tables B12501, B12503, B12505 and B12001, CDC/NCHS, marriage rates by state data
Older adults and the currently divorced
- 27.
Among currently married adults, 76% of men and 77% of women were in their first marriage in 2016, the latest year of the Census Bureau’s detailed marital history report.
- 28.
At least 59% of Americans aged 60 or older have been married just once, according to Census Bureau data released in 2021 (2016 ACS and 2014 SIPP).
- 29.
One-third of Americans who had ever married reported in 2023 that their first marriage ended in divorce, meaning about two in three said it had not.
- 30.
Utah has the lowest share of ever-married adults who are currently divorced, at 12.5%, followed by New Jersey (13.1%) and North Dakota (13.6%) (2025).
— Gustavo Athayde analysis of U.S. Census Bureau, ACS 1-year tables B12501, B12503, B12505 and B12001 data
- 31.
Nationally, 15.7% of ever-married Americans are currently divorced, and New Mexico (20.4%) is the only state where the share reaches one in five (2025).
— Gustavo Athayde analysis of U.S. Census Bureau, ACS 1-year tables B12501, B12503, B12505 and B12001 data
- 32.
49.4% of Americans aged 15 and older are currently married, about 140 million people (2025).
— Gustavo Athayde analysis of U.S. Census Bureau, ACS 1-year tables B12501, B12503, B12505 and B12001 data
- 33.
About two-thirds (66%) of Americans who have divorced have gone on to remarry (2023).
First marriages by region
How long American marriages last
Duration is measured less often than divorce, but the figures that exist describe a country where long marriages remain common, especially among older Americans and across the Upper Midwest.
Anniversaries today
- 34.
The median length of a current American marriage is 19 years, a figure that has held steady since 2010 (latest available data, 2018).
- 35.
For couples in a first marriage, the median length rises to 21 years (2018).
- 36.
41% of currently married Americans have reached their 25th anniversary, 8% their golden anniversary and 2% their 60th (2018).
- 37.
Just under half (46.9%) of married Americans aged 70 and older have been married for 50 years or more (2022).
- 38.
South Dakota has the highest share of long marriages among older adults, at 58.2% married 50 years or more, while Washington, D.C. has the lowest at 32.5% (2022).
- 39.
South Dakota’s share of golden-anniversary marriages among adults 70 and older is 24% higher than the national share (58.2% vs. 46.9%, 2022).
— Gustavo Athayde analysis of NCFMR, Bowling Green State University data
- 40.
The states with the highest shares of 50-year marriages, the top quartile, are concentrated in the Midwest (2022).
- 41.
Among older adults still in their first marriage, 65.2% have been married at least 50 years (2022).
- 42.
Across all ages, 7.7% of current American marriages have reached the 50-year milestone (2022).
Cohorts, probabilities and records
- 43.
More than half of first marriages that began between 1970 and 1984 reached their 25th anniversary, for both men and women (2014 data, latest available).
- 44.
75.6% of women who married between 1995 and 1999 reached their 10th anniversary, the highest share among the women’s marriage cohorts measured (2014 data).
- 45.
In 2006–2010, the probability that a first marriage would last at least 10 years was 68% for women and 70% for men (historical data).
- 46.
The same survey put the probability of a first marriage reaching 20 years at 52% for women and 56% for men (2006–2010).
- 47.
The world’s longest marriage for a living couple belongs to an American couple, Lyle and Eleanor Gittens, married on June 4, 1942: 83 years and 153 days as of November 4, 2025.
- 48.
The longest marriage ever recorded is also American: Herbert and Zelmyra Fisher were married 86 years and 290 days as of February 27, 2011.
What this means for families. A marriage of 50 years is a family’s shared inheritance. Many couples mark the milestone with a family crest or a wax seal that the next generation will use in turn.
The long decline in divorce
By every major measure, divorce in America is less common than it was a generation ago, and marriages that do end are lasting longer before they do.
Rates and trends
- 49.
The U.S. divorce rate stood at 2.3 per 1,000 people in 2024 among the 45 reporting states and D.C.
- 50.
That rate is 42.5% lower than in 2000, when it stood at 4.0 per 1,000 (2000–2024; the set of reporting states differs slightly between the two years).
— Gustavo Athayde analysis of CDC/NCHS, National Vital Statistics System data
- 51.
The refined divorce rate was 14.2 divorces per 1,000 married women in 2024, slightly below 14.4 in 2023.
- 52.
That measure peaked around 1980 at 22.6 divorces per 1,000 married women and still stood at 20.5 in 2008, so much of the decline came in the past 15 years (2023).
- 53.
The first-divorce rate fell from 18.7 per 1,000 women in a first marriage in 2008 to 13.4 in 2023; for men in a first marriage it fell from 16.9 to 11.5.
- 54.
Just 18% of marriages formed between 2010 and 2012 had ended in divorce after 10 years, compared with 30% of marriages from the 1970s (SIPP 2021–2023).
- 55.
That 10-year figure is approaching the levels of the 1950s, when only 14% of marriages dissolved within a decade (SIPP 2021–2023).
Projections, timing and states
- 56.
Researchers at the Institute for Family Studies project that about 40% of today’s first marriages will end in divorce (projection, 2025); a separate projection by sociologist Yifeng Wan puts it at 42%.
- 57.
Lifetime divorce risk is projected at about 47% for couples who married in the 1990s and about 44% for those who married in the 2000s (projection, 2025).
- 58.
The median length of a marriage at first divorce rose from 11 years in 2008 to 13 years for men and 14 years for women in 2024.
- 59.
Only 16% of divorces in 2023 came within the first five years of marriage, while 22% ended marriages of 25 years or longer.
- 60.
Illinois (1.3), Massachusetts (1.5) and Kansas (1.7) recorded some of the lowest divorce rates per 1,000 residents among reporting states in 2024; only Louisiana reported a lower figure (0.8).
- 61.
Maine had the lowest refined divorce rate in 2024, with 10.0 divorces per 1,000 married women, followed by Wisconsin (10.8) and New Jersey (11.0).
- 62.
25% of ever-married adults with a bachelor’s degree have divorced, compared with 37% of those with a high school education or less (2023).
- 63.
Among married women aged 50 and older, the divorce rate was 10.3 per 1,000 in 2023, up from 3.9 in 1990.
Where and when Americans marry
Marriage itself has shifted later in life. The median age at first marriage is now near 30, a trend covered in our state ranking of marriage age.
Marriage rates by state
- 64.
The U.S. marriage rate was 6.3 per 1,000 people in 2024, recovered from 5.1 in 2020 though below the 8.2 of 2000.
- 65.
After Nevada, Utah (13.4), Hawaii (12.4) and Montana (9.2) recorded the highest state marriage rates per 1,000 residents in 2024.
- 66.
The refined marriage rate was 31.2 marriages per 1,000 unmarried women in 2024, and Utah led the nation for the fifth year in a row at 51.7.
- 67.
17.2 of every 1,000 Americans aged 15 and older married in the year before the 2025 survey, against 6.3 who divorced.
— Gustavo Athayde analysis of U.S. Census Bureau, ACS 1-year tables B12501, B12503, B12505 and B12001 data
Marriage across the life course
- 68.
The median age at first marriage reached 30.8 for men and 28.4 for women in 2025, compared with 23.5 and 21.1 in 1975.
- 69.
Married couples made up 47% of U.S. households in 2025, compared with 66% in 1975.
- 70.
81% of American women aged 40 to 44 had ever married in 2024, compared with 95% in 1979.
- 71.
Among Americans aged 65 and older, 68% of men and 46% of women were married in 2024.
- 72.
Half of American adults (50%) were not currently married in 2024, compared with 28% in 1960.
What helps a marriage last
Research cannot promise any couple an outcome, but several habits and circumstances appear again and again in the data on durable, satisfied marriages. These comparisons are associations, not proof of cause.
Faith, timing and deliberate choices
- 73.
Americans who regularly attend church are about 30% to 50% less likely to divorce (2024 analysis drawn from Brad Wilcox’s book Get Married).
- 74.
Regular churchgoers are also about 15 percentage points more likely to say they are happily married than secular couples (2024 analysis).
- 75.
Among couples who married in the 2010s, 23% of those who moved in together only after engagement or marriage saw their marriage end, compared with 34% of those who lived together before engagement (2022 survey).
- 76.
Couples who talked it through and made a deliberate decision to live together had a 21% marriage-ending rate, compared with 34% for couples who slid into it (2022 survey).
- 77.
Husbands who married at ages 20 to 24 report higher marital satisfaction than those who married later, 81% vs. 71% (2022 report).
- 78.
Before about age 32, each additional year of age at marriage reduced the odds of divorce by 11%, according to a 2015 analysis of 2006–2010 federal survey data (historical).
Marriage and well-being
- 79.
61% of married adults aged 25 to 50 were thriving in 2023, compared with 45% of never-married adults, a 16-point gap.
— Gallup
- 80.
83% of married parents living with their children say they are in a strong and loving relationship with their spouse (2023).
— Gallup
- 81.
86% of married men and 87% of married women say they are happy with their lives, compared with 66% and 69% of single Americans (2025, Survey Center on American Life).
— AEI Survey Center on American Life, AEI Survey Center on American Life
- 82.
53% of married Americans are very or completely satisfied with their personal lives, compared with 28% of single Americans (2025).
- 83.
85% of Americans in a relationship are satisfied with it, including 55% who are completely satisfied (2025, n=3,000).
— Gustavo Athayde analysis of American Family Survey 2025 (BYU Wheatley Institute and Deseret News) data
- 84.
64% of Americans in relationships longer than two years say it was not in trouble at any point in the past two years, and 45% say it is stronger than two years ago (2025).
— American Family Survey 2025 (BYU Wheatley Institute and Deseret News)
- 85.
29% of married Americans experienced at least one economic crisis in the past year, compared with 39% of unmarried Americans (2025).
— American Family Survey 2025 (BYU Wheatley Institute and Deseret News)
Family, faith and the next generation
Durable marriages shape the homes children grow up in, and recent data point to a modest renewal of family stability.
Children and family structure
- 86.
66% of American children are being raised by married parents, up from a low of 64% in 2012 (latest Current Population Survey data, reported in 2025).
- 87.
The share of children living in an intact family with both biological, married parents rose from 51% in 2014 to 54% in 2024.
- 88.
Utah ranks first on the 2026 Family Structure Index with a score of 103, followed by Idaho, Nebraska and South Dakota.
— Institute for Family Studies and Center for Christian Virtue, Family Structure Index
- 89.
39% of Americans say it is very important for a couple who have a child together to be legally married, up 10 points from 2020 (2026, n=1,001).
— Gallup
- 90.
Among weekly churchgoers, the share who say parents should marry rose from 41% in 2020 to 65% in 2026.
— Gallup
Values, names and shared lives
- 91.
82% of Americans say their parents were married when they were born, and 67% were raised in a two-parent household (2026).
— Gallup
- 92.
86% of unmarried young adults aged 22 to 35 expect to marry (2025 survey, released 2026).
- 93.
Fewer than 20% of Americans agree that marriage is “old fashioned” or “more of a burden than a benefit” (2025).
- 94.
79% of women in opposite-sex marriages say they took their husband’s last name, 14% kept their own and 5% hyphenated (2023).
- 95.
77% of married couples with accounts at financial institutions held at least one account jointly in 2023, and 79% of couples married nine to 13 years held bank accounts jointly.
What this means for the next generation. Shared names and shared symbols carry a family’s story forward. A signet or a wedding monogram passed from parents to children turns a marriage into a legacy.
Celebrating love that lasts
Valentine’s Day remains the country’s largest annual celebration of romance, and spending on it reached new highs in 2026.
- 96.
Americans planned a record $29.1 billion in Valentine’s Day spending in 2026, a record average of $199.78 per celebrant (n=7,791).
- 97.
83% of Valentine’s Day celebrants planned a gift for a spouse or significant other in 2026, worth $14.5 billion in total.
- 98.
Jewelry is the largest Valentine’s Day category by spending, at $7 billion in 2026, or 24.1% of the total, with 25% of celebrants planning to give it.
— Gustavo Athayde analysis of National Retail Federation and Prosper Insights data
- 99.
35% of consumers bought flowers or plants for Valentine’s Day 2026, matching the record, and roses made up 87% of those purchases.
- 100.
61% of couples who married in 2025 wrote their own wedding vows (n=10,474).
Methodology
The Lasting Marriage Index uses the U.S. Census Bureau’s American Community Survey 1-year estimates for 2023, 2024 and 2025 (tables B12501, B12503, B12505 and B12001), read from the Census Bureau’s summary files. It averages three measures, each scaled from 0 to 100 across the 50 states: people who married in the past year per person who divorced (2023–2025 combined, men and women), the share of ever-married adults aged 15 and older who have married only once (2025), and the share of ever-married adults who are currently divorced (2025, inverted).
Margins of error were propagated from the published 90% margins; two states are described as statistically tied when the difference between their scores is smaller than the square root of the sum of their squared margins. States with the same displayed score share a rank. D.C. and Puerto Rico are shown but not ranked.
The ACS asks about marriages and divorces in the 12 months before the survey and counts people, not couples, so its ratios differ from vital-records counts kept by the CDC, which record events by the state where they occur and exclude divorces in five states (the set of non-reporting states also changes over time). Comparisons in this article are descriptive and do not establish cause. Figures older than five years are labeled as historical.
About the author

Gustavo Athayde — Founder & Creative Director, GUSTAVO ATHAYDE
Gustavo Athayde is the founder and creative director of GUSTAVO ATHAYDE, a bespoke monogram atelier based in Sioux Falls, South Dakota. A graphic designer by training, he creates monograms, personal and family crests, heraldic emblems, signet designs and wax seals for individuals, families, couples and brands across the United States. Every commission is refined line by line into a symbol meant to be kept, used and passed down.
Follow the atelier on Instagram · Request a private consultation
Frequently asked questions
- Which state has the longest-lasting marriages?
- Utah ranks first on the Gustavo Athayde Lasting Marriage Index with a score of 91.7 out of 100. New Jersey, New York and Hawaii are statistically tied with it.
- How long does the average American marriage last?
- The median current marriage has lasted 19 years, and 21 years for couples in a first marriage, according to the latest NCFMR analysis of Census data (2018).
- Is the divorce rate going down?
- Yes. The CDC divorce rate fell from 4.0 per 1,000 people in 2000 to 2.3 in 2024, and the refined divorce rate fell to 14.2 per 1,000 married women in 2024.
- How many marriages are there for every divorce?
- In 2025, 2.73 Americans married for every one who divorced, counting men and women; among women alone the ratio was 2.52, the widest margin in the ACS record.
- What share of Americans have married only once?
- About 76.3% of ever-married Americans aged 15 and older have married only once, and 5.1% have married three or more times (2025).
- Where are 50-year marriages most common?
- South Dakota leads, with 58.2% of married adults aged 70 and older married 50 years or more in 2022, compared with 46.9% nationally.
Cite this page
Source: Gustavo Athayde, "The States Where Marriages Last the Longest 2026", https://gustavoathayde.com/marriages-last-longest/Feel free to use these statistics and charts — we just ask for a link back to this page.
Sources
- ACS 2025 1-year, B12503: Divorces in the Last Year (U.S. Census Bureau)
- Almost a Quarter of Married Couples Didn’t Have Joint Accounts in 2023 (2025) (U.S. Census Bureau)
- American Community Survey 1-year Summary File, tables B12501, B12503, B12505, B12001 (2021–2025) (U.S. Census Bureau)
- Divorce rates by State: 1990, 1995, and 2000–2024 (CDC/NCHS)
- Families and Living Arrangements press release (December 2, 2025) (U.S. Census Bureau)
- First Marriages in the United States: Data From the 2006–2010 National Survey of Family Growth (NHSR No. 49) (CDC/NCHS)
- Love and Loss Among Older Adults (2021) (U.S. Census Bureau)
- Marriage rates by State: 1990, 1995, and 2000–2024 (CDC/NCHS)
- Number, Timing, and Duration of Marriages and Divorces: 2016 (P70-167) (U.S. Census Bureau)
- Press release: Marriages and Divorces (April 22, 2021) (U.S. Census Bureau)
- Provisional number of marriages and divorces and rates: United States, 2000–2024 (CDC/NCHS)
Academic research
- 2022 State of Our Unions: Capstones vs. Cornerstones (National Marriage Project)
- Duration of Marriage at First Divorce (FP-26-15) (NCFMR (BGSU))
- First Divorce Rate in the U.S. (FP-25-02) (NCFMR (BGSU))
- Long-Term Marriages among Older U.S. Adults, 2022 (FP-24-01) (NCFMR (BGSU))
- Long-Term Marriages among Older U.S. Adults, 2022 (FP-24-01, PDF) (NCFMR (BGSU))
- Marriage-Divorce Ratio in the U.S.: Geographic Variation, 2024 (FP-25-32) (NCFMR (BGSU))
- Median Duration of Marriages in the U.S., 2018 (FP-20-16) (NCFMR (BGSU))
- Refined Divorce Rate in the U.S.: Geographic Variation, 2024 (FP-25-31) (NCFMR (BGSU))
- Refined Marriage Rate: Geographic Variation, 2024 (FP-25-30) (NCFMR (BGSU))
- Relationship Status of U.S. Adults 50+ (AFP-26-02) (BGSU Center for Aging Families)
- The Dating Recession: State of Our Unions 2026 (Wheatley Institute and IFS)
- Unmarried Adulthood: A Century of Change, 1900–2024 (FP-26-08) (NCFMR (BGSU))
- Women’s Ever-Married Rate (FP-25-14) (NCFMR (BGSU))
Research institutes and surveys
- 8 facts about divorce in the United States (October 16, 2025) (Pew Research Center)
- A Cultural Crossroads (2025) (AEI Survey Center on American Life)
- About eight-in-ten women in opposite-sex marriages say they took their husband’s last name (2023) (Pew Research Center)
- Americans More Likely to Say Parents Should Marry (2026) (Gallup)
- Divorce in Decline: About 40% of Today’s Marriages Will End in Divorce (2025) (Institute for Family Studies)
- First in Family (2026 Family Structure Index) (Institute for Family Studies)
- full report (BYU Wheatley Institute, Deseret News) (American Family Survey 2025)
- Increasing Indifference to the Institution of Marriage (2025) (American Family Survey)
- Is Marriage Back? Divorce Is Down, Family Stability Is Up (2025) (Institute for Family Studies)
- Married Americans Thriving at Higher Rates Than Unmarried Adults (2024) (Gallup)
- Much Ado About Marriage (2025) (AEI Survey Center on American Life)
- Want to Avoid Divorce? Wait to Get Married, But Not Too Long (2015) (Institute for Family Studies)
- Want to Slash Your Risk for Divorce? Start Going to Church (2024) (Institute for Family Studies)
- What’s the Plan? Cohabitation, Engagement, and Divorce (2023) (Institute for Family Studies)
Records and consumer data
- 2026 Real Weddings Study press release (Business Wire, February 18, 2026) (The Knot)
- Longest marriage for a living couple (Guinness World Records)
- Valentine’s Day spending expected to reach new records (January 27, 2026) (NRF)
- Valentine’s flower buying holds record high (2026) (Society of American Florists)
- World’s longest marriages (2022) (Guinness World Records)