
Family Heirloom Statistics 2026: What Americans Keep and Pass Down
Americans have not stopped passing things down; they are passing down less, and choosing more carefully. These family heirloom statistics show that 58% of Americans have received a sentimental item from a relative, even as 49% say they would rather inherit nothing than clear out a house full of belongings. The two findings fit together: a majority would rather receive a few meaningful pieces than everything a loved one owned.
Below are 100 statistics from the Census Bureau, the Federal Reserve, the IRS, the Bureau of Labor Statistics and leading surveys, including an original ranking of the states where families have held the same home for more than 35 years.
At a glance
Key takeaways
- 58% of Americans have received a sentimental heirloom, and 59% plan to leave something behind.
- Photo albums are the most commonly inherited item; jewelry and clothing follow at 25% each.
- 32% of Americans most hope to inherit an engagement ring, the top item on the wish list.
- 39% of Gen Z plan to leave an inheritance, the highest share of any generation.
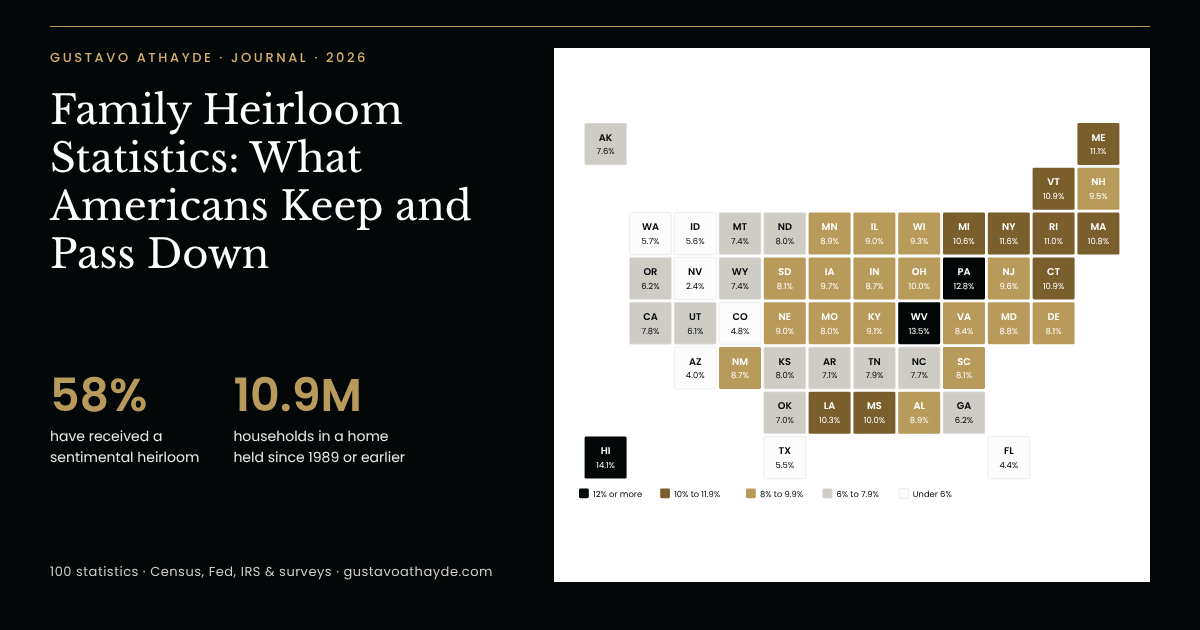
- Hawaii (14.1%) and West Virginia (13.5%) lead in homes held since 1989 or earlier; the U.S. average is 8.1%.
- $13 billion was spent on gold jewelry in the U.S. in 2025, up 28% as gold set 53 record highs.
- 47% of the dollars bequeathed on 2024 estate tax returns went to surviving spouses.
- 49% would rather inherit nothing than sort through a relative’s belongings, a call for fewer, better heirlooms.
- Vermont has 13.9 used-merchandise and antique stores per 100,000 residents, 2.4 times the national rate.
- Almost 90% of wealthy art collectors keep the works they inherit.
What Americans keep and pass down
Most American families still hand something down. The surveys below show that heirlooms have not disappeared; the list has simply grown shorter and more personal. A recipe, a box of photographs and a few pieces chosen for their story now matter more than a full set of furniture.
- 1.
58% of Americans have received a sentimental item passed down from a family member, according to a 2025 survey of 2,000 adults.
- 2.
59% of Americans plan to leave something behind for their family, including 68% of parents and 45% of adults without children (2025).
- 3.
51% of Americans would rather inherit a select few items from a loved one than everything they own; only 20% would choose everything (2026).
- 4.
17 is the average number of a relative’s belongings that Americans say would actually feel meaningful to inherit, a short list compared with the contents of a whole house (2026, 1,200 U.S. adults).
- 5.
43% of Americans say sentimental value is what keeps them holding on to inherited items (2026).
Pieces chosen to last
- 6.
52% of Americans have already thought about what they will leave behind (2026).
- 7.
83% of homeowners who own special-occasion pieces, such as fine dishes and glassware, plan to pass them down to family (2025, 2,000 homeowners).
- 8.
41% of homeowners surveyed have bought items intending them to become family heirlooms (2025).
- 9.
55% of Americans have a treasured family recipe shared through the years, and 52% say that recipe is more than 25 years old (2025, 5,000 adults).
- 10.
81% of Americans agree that saved objects, photos and keepsakes help tell the story of their life (2026, 2,400+ adults in 48 states).
— Mixbook
What this means
A smaller inheritance asks for better choices. The pieces that endure are the ones a family can use and recognize, which is why a family crest or a set of engraved initials so often becomes the thread that ties the rest together.
Family heirloom statistics by object
Photographs and jewelry dominate every list of what Americans inherit, prize and hope to receive. The table brings together four separate surveys; their questions differ, so each column should be read on its own.
The most commonly inherited items
- 11.
26% of adults surveyed in the U.S., Canada and Australia have inherited photo albums, the most common inherited item, followed by clothing and jewelry (25% each) and furniture (22%) (2026).
- 12.
43% of those adults plan to leave family photos to their heirs, tied with cash (43%) and ahead of jewelry (39%) (2026, U.S., Canada and Australia).
- 13.
32% of Americans most hope to inherit an engagement ring, ahead of other jewelry (29%), a wedding ring or a watch (26% each), a wedding dress (25%) and the family home (18%) (2020).
- 14.
65% of Americans count family photos among their most prized possessions, ahead of a wedding ring (56%) and a piece of jewelry (54%); 49% name a family heirloom (2020).
- 15.
65% of Americans list property on their inheritance wish list, followed by pets (59%), money (58%), and collectibles and vehicles (53% each), in a 2023 survey of 2,000 adults.
Heirlooms by type of object
Object Hope to inherit (2020) Among most prized (2020) Have inherited (2026)* Plan to leave (2026)* Family photos or albums – 65% 26% 43% Jewelry (any piece) 29% 54% 25% 39% Engagement ring 32% 50% – – Wedding ring 26% 56% – – Watch 26% – – – Wedding dress 25% 41% – – Wedding veil 19% – – – Family home 18% – – – Kitchen item 17% – – – Clothing 14% – 25% – Furniture – – 22% – Cash or investments – – 19% 43% A family heirloom (any) – 49% – –
Sources: hope to inherit and most prized, OnePoll survey of 2,000 U.S. adults for Shinola (via SWNS); have inherited and plan to leave, 1-800-GOT-JUNK? and Talker Research, *2,200 adults in the U.S., Canada and Australia. Columns come from different surveys and are not directly comparable. – = not asked.
Keepsakes parents save
- 16.
44% of Americans would rather inherit something of financial value, while 27% prefer something sentimental (2023).
- 17.
95% of parents of adult children still have pictures of them as young children, and 74% have kept their artwork (2024).
— YouGov
- 18.
55% of parents of adult children have kept cards or letters from them, 35% a lock of hair and 29% baby teeth (2024).
— YouGov
- 19.
35% of parents of adult children wish they had kept more from their children’s childhood (2024).
— YouGov
- 20.
18% of federal estate tax returns filed in 2024 (1,296 of 7,195) reported works of art, worth $2.7 billion in total, an average of about $2.1 million per estate that held art.
— Internal Revenue Service; Gustavo Athayde analysis
What this means
Photographs, rings and watches lead because they are small, personal and easy to carry into a new home. For couples, the engagement ring is the piece most hoped for; for collectors and estates, art and the family home carry the value.
Heirlooms and inheritance by generation
The idea that younger Americans want nothing from their parents does not survive a look at the data. Gen Z is the generation most likely to plan an inheritance of its own, and young adults are the most devoted keepers of cards and notes.
- 21.
31% of U.S. adults expect to leave an inheritance or a charitable gift, up from 26% a year earlier (2025, 4,626 adults).
- 22.
20% of U.S. adults expect to receive an inheritance, down from 25% in 2024.
- 23.
39% of Gen Z adults plan to leave an inheritance, the highest share of any generation, and 30% expect to receive one (2025).
- 24.
3.3 to 1: Americans of the Boomer generation and older are more than three times as likely to plan to leave an inheritance (30%) as to expect one (9%); in every generation, more people plan to give than expect to receive (2025).
— Northwestern Mutual; Gustavo Athayde analysis
- 25.
22% of Gen Z adults say values and life lessons will be the most meaningful thing they leave behind, compared with 15% of the Silent Generation, who are nearly twice as likely as Gen Z to name a home or property (28% vs. 14%) (2025).
Heirloom attitudes by generation
Generation Plan to leave an inheritance (2025) Expect to receive one (2025) Other findings Gen Z 39% 30% 22% name values and life lessons as their legacy; 16% of Gen Z couples place any importance on “something old” Millennials 32% 26% 63% are counting on an inheritance; 25% of Millennial couples place any importance on “something old” Gen X 26% 20% 45% lack basic estate documents; 60% have set aside an heirloom to pass along (2018) Boomers and older 30% 9% 41% of Boomers lack basic estate documents; 28% of the Silent Generation name a home or property as their legacy
Sources: Northwestern Mutual (plan and expect columns, 4,626 adults); Trust & Will; De Beers; LegalShield; Mayflower. Generation definitions follow each source.
What young Americans keep
- 26.
60% of adults ages 18 to 28 keep cards and handwritten notes indefinitely, compared with 46% of those 61 and older (2026).
— Mixbook
- 27.
41% of older, longer-married couples highly value the “something old, something new” wedding tradition, while only a quarter of Millennial couples and 16% of Gen Z couples place any importance on it (2025).
- 28.
63% of Millennials are already counting on an inheritance, according to a 2025 LegalShield survey of 1,018 adults; Northwestern Mutual, asking a different question, puts the share of Millennials who expect one at 26%.
- 29.
42% of young Americans do not feel financially prepared to keep and maintain an inherited home (2025, Gen Z and Millennial respondents).
- 30.
60% of Gen X adults have put an heirloom in a safe place to pass along someday, compared with 53% of Millennials (2018).
What this means
The appetite is real, but it is selective. Younger heirs choose what they can wear, display or use. Pieces made personal, such as a personal monogram or a ring carrying a grandparent’s initials, travel between generations far better than formal china.
Jewelry and watches: the heirlooms that travel
Jewelry and watches are the classic portable heirloom. Record gold prices in 2025 lifted what Americans spend on them, and younger buyers are turning to pre-owned pieces with a history.
- 31.
$13 billion was spent on gold jewelry in the United States in 2025, up 28% from 2024 as prices climbed.
- 32.
$3,431 an ounce was the average gold price in 2025, the highest annual average to date and 44% above 2024; the LBMA gold price set 53 new all-time highs during the year.
- 33.
$106.2 billion was what Americans spent on jewelry and watches in 2025 (personal consumption expenditures, current dollars).
- 34.
53% more was spent on jewelry and watches in 2025 than in 2015 ($69.4 billion), in current dollars; spending rose 1.7% in 2025 alone.
— U.S. Bureau of Economic Analysis; Gustavo Athayde analysis
- 35.
More than half of U.S. fine-jewelry owners say losing a piece would be a significant sentimental loss, not only a financial one (2024, 1,500 owners).
Watches, jewelers and the pre-owned market
- 36.
49% of Americans engaged or married within the past five years insured their engagement ring at purchase, though 62% count it among the three most expensive things they own (2026, 2,000 adults).
- 37.
17% of Swiss watch exports went to the United States in 2025, the industry’s largest market, out of 25.6 billion Swiss francs in total.
- 38.
40% of Gen Z consumers intend to buy a pre-owned watch in the next 12 months, twice the share of Baby Boomers (20%), in a 2025 survey of Switzerland and its main export markets, including the U.S.
— Deloitte
- 39.
19,897 jewelry stores operated in the United States in 2023, employing 106,903 people.
- 40.
14.7 jewelry stores per 100,000 residents make Hawaii the most jeweler-dense state, 2.5 times the national rate of 5.9 (2023).
— U.S. Census Bureau; Gustavo Athayde analysis
What this means
Gold at record prices makes inherited jewelry more valuable, and more worth insuring and documenting. A signet ring engraved with a family emblem is among the oldest examples of jewelry designed from the start to be passed down.
The long-held family home: a state ranking
The home is the largest heirloom many families hold, and the place where everything else is kept. To see where families stay put, we ranked every state by the share of households living in a home they moved into in 1989 or earlier, using the Census Bureau’s 2025 American Community Survey. Differences smaller than the combined margin of error are treated as statistical ties.
The map of long-held homes
SHARE THIS CHART
Copy the code below to embed this chart on your site:
- 41.
10.9 million American households, 8.1% of the total, live in a home they moved into in 1989 or earlier, more than 35 years ago (2025).
— U.S. Census Bureau; Gustavo Athayde analysis
- 42.
94% of those long-held homes are owned rather than rented (2025).
— U.S. Census Bureau; Gustavo Athayde analysis
- 43.
14.1% of households in Hawaii have lived in the same home since 1989 or earlier, the highest share in the nation, statistically tied with West Virginia (13.5%) (2025).
— U.S. Census Bureau; Gustavo Athayde analysis
- 44.
12.8% of Pennsylvania households have held their home since 1989 or earlier, the highest share among large states, followed by New York (11.6%) (2025).
— U.S. Census Bureau; Gustavo Athayde analysis
- 45.
5 New England states, Maine (11.1%), Rhode Island (11.0%), Vermont (10.9%), Connecticut (10.9%) and Massachusetts (10.8%), rank in the national top 10 for long-held homes (2025).
— U.S. Census Bureau; Gustavo Athayde analysis
Homes, estates and an older America
- 46.
26 states have a share of long-held homes statistically above the national 8.1%, while 15 are below it (2025).
— U.S. Census Bureau; Gustavo Athayde analysis
- 47.
2.4% of Nevada households have lived in the same home since 1989 or earlier, the lowest share, reflecting its rapid population growth; Arizona (4.0%) and Florida (4.4%) follow (2025).
— U.S. Census Bureau; Gustavo Athayde analysis
- 48.
65.6% of U.S. families owned their primary residence in 2025, compared with 66.1% in 2022.
- 49.
67% of federal estate tax returns filed in 2024 (4,814 of 7,195) included a personal residence, valued at $10.3 billion in total.
— Internal Revenue Service; Gustavo Athayde analysis
- 50.
64.6 million Americans were 65 or older on July 1, 2025, up 16.2% since April 2020, about 90 for every 100 children under 18.
— U.S. Census Bureau; Gustavo Athayde analysis
Full ranking: states 1 to 25
Rank State Households in a home held since 1989 or earlier Margin of error (pts) Used-merchandise stores per 100,000 Jewelry stores per 100,000 1 Hawaii 14.1% ±0.7 4.4 14.7 2 West Virginia * 13.5% ±0.6 7.1 3.8 3 Pennsylvania 12.8% ±0.2 5.9 5.5 4 New York 11.6% ±0.2 4.6 9.9 5 Maine 11.1% ±0.6 10.8 5.0 6 Rhode Island 11.0% ±0.7 6.3 7.4 7 Vermont 10.9% ±0.8 13.9 7.6 8 Connecticut 10.9% ±0.5 5.7 5.9 9 Massachusetts 10.8% ±0.3 4.4 7.7 10 Michigan 10.6% ±0.2 6.0 5.4 11 Louisiana 10.3% ±0.4 4.9 5.7 12 Mississippi 10.0% ±0.4 5.7 3.6 13 Ohio 10.0% ±0.2 6.2 4.7 14 Iowa 9.7% ±0.3 8.4 4.4 15 New Jersey 9.6% ±0.3 3.0 7.6 16 New Hampshire 9.5% ±0.6 8.1 8.4 17 Wisconsin 9.3% ±0.3 7.6 4.6 18 Kentucky 9.1% ±0.3 6.7 3.7 19 Illinois 9.0% ±0.2 5.2 5.6 20 Nebraska 9.0% ±0.4 7.1 4.2 21 Minnesota 8.9% ±0.3 6.2 4.7 22 Alabama 8.9% ±0.3 6.4 4.6 23 Maryland 8.8% ±0.3 4.6 5.4 24 Indiana 8.7% ±0.3 7.5 4.1 25 New Mexico 8.7% ±0.5 6.6 6.6
Full ranking: states 26 to 50
Rank State Households in a home held since 1989 or earlier Margin of error (pts) Used-merchandise stores per 100,000 Jewelry stores per 100,000 26 Virginia 8.4% ±0.2 6.9 5.4 27 South Carolina 8.1% ±0.3 6.6 5.4 28 South Dakota 8.1% ±0.6 11.0 4.2 29 Delaware 8.1% ±0.7 5.8 8.6 30 Missouri 8.0% ±0.3 6.4 4.1 31 Kansas 8.0% ±0.4 7.3 4.6 32 North Dakota 8.0% ±0.6 9.3 5.1 33 Tennessee 7.9% ±0.2 6.3 4.5 34 California 7.8% ±0.1 4.7 6.7 35 North Carolina 7.7% ±0.2 6.8 5.0 36 Alaska 7.6% ±0.7 8.8 10.2 37 Montana 7.4% ±0.6 12.0 6.8 38 Wyoming 7.4% ±0.7 6.5 5.1 39 Arkansas 7.1% ±0.4 7.0 3.8 40 Oklahoma 7.0% ±0.2 6.5 3.4 41 Georgia 6.2% ±0.2 5.4 5.7 42 Oregon 6.2% ±0.3 9.0 5.0 43 Utah 6.1% ±0.3 4.0 3.8 44 Washington 5.7% ±0.2 7.6 4.5 45 Idaho 5.6% ±0.4 8.9 4.6 46 Texas 5.5% ±0.1 4.7 5.1 47 Colorado 4.8% ±0.2 7.5 5.2 48 Florida 4.4% ±0.1 5.5 8.2 49 Arizona 4.0% ±0.2 5.6 4.8 50 Nevada 2.4% ±0.2 4.6 7.9
About the ranking data
Rank = share of occupied housing units whose householder moved in during 1989 or earlier (owners and renters), ACS 2025 1-year estimates, Table B25038; margins of error at 90%. * = statistically tied with the leader. Stores per 100,000 residents: County Business Patterns 2023 (NAICS 453310 used merchandise stores, which include antique shops; NAICS 448310 jewelry stores) divided by Census Vintage 2024 population for July 1, 2023. United States: 8.1% (±0.04), 5.8 and 5.9. District of Columbia: 5.5%, not ranked. Source: U.S. Census Bureau; Gustavo Athayde analysis.
What this means
Where families stay put, objects accumulate in place: the attic trunk, the dining table, the portrait over the stairs. In the faster-growing states of the West and South, families carry fewer things across more miles. Many of these households also share a roof across generations, as our multigenerational households ranking shows.
The Great Wealth Transfer and what estates leave
Behind every heirloom sits a larger handoff. Projections of the coming wealth transfer run into the trillions, while federal estate tax returns show where the largest estates actually go: first to spouses, then to children.
- 51.
$124 trillion in U.S. wealth is projected to change hands through 2048; UBS, using a different global method, expects more than $29 trillion in U.S. transfers over 20 to 25 years (projection, 2024).
- 52.
$105 trillion of that transfer is expected to flow to heirs and $18 trillion to charity (projection through 2048).
- 53.
$54 trillion is projected to pass between spouses first, nearly $40 trillion of it to widowed women of the Baby Boomer and older generations (projection through 2048).
- 54.
$46 trillion is projected to pass to Millennials, the most of any generation over the next 25 years (projection, 2024).
- 55.
7,195 federal estate tax returns were filed in 2024, reporting $248.9 billion in gross estates; only 2,663 of those estates owed estate tax.
Who inherits: bequests by beneficiary
- 56.
$179.4 billion in bequests was reported on 2024 estate tax returns, including $83.8 billion to surviving spouses and $42.4 billion to children.
- 57.
47% of the dollars bequeathed on 2024 estate tax returns went to a surviving spouse and 24% to children; grandchildren and great-grandchildren received $2.8 billion (2024).
— Internal Revenue Service; Gustavo Athayde analysis
- 58.
$37.5 billion in charitable deductions was claimed on 1,733 estate tax returns filed in 2024, about one in four returns.
- 59.
3.4% of U.S. adults received an inheritance in 2024; the median inheritance was $17,500 and the mean $144,800.
- 60.
42% of U.S. adults gave a financial transfer to family members or others in 2024, and 21% received one; the largest transfers involved housing, education or inheritances.
What this means
Most money moves first between spouses and only later to children and grandchildren, so many heirlooms change hands twice. A short written note on each important piece, saying who made it, who wore it and who should receive it, settles questions that a will often leaves open.
Wills, family conversations and traditions
Fewer than half of Americans have a will, and many families never talk about what will happen to their belongings. Yet the same surveys show deep attachment to memories and traditions, which is where legacy begins.
- 61.
24% of U.S. adults had a will in 2025, down from 33% in 2022; Gallup, asking a different question in 2021, found 46%, including 76% of adults 65 and older.
— Caring.com; Gallup
- 62.
43% of Americans without a will say they “just haven’t gotten around to it” (2025).
- 63.
45% of Gen X adults and 41% of Boomers do not have basic estate planning documents such as a will (2025).
- 64.
26% of Americans never discuss inheritance plans with their family (2026).
- 65.
60% of Americans who expect to leave an inheritance or charitable gift have talked with family members about their plans (2025).
Memories and traditions
- 66.
80% of Americans care about the impression they leave on loved ones, and 36% name leaving things behind for them among their hopes as they age (2025).
- 67.
69% of Americans most want to be remembered for the memories they shared with loved ones; 4% say for their accumulated wealth (2018, 3,000+ adults).
- 68.
84% of Americans believe passing holiday traditions from one generation to the next benefits younger generations, and 82% say it benefits older ones (2022).
- 69.
47% of Americans say at least most of their holiday traditions were passed down to them (2022).
- 70.
44.2% of U.S. families gave or received money or time within an informal network of family and friends (2024 reference year).
What this means
A will divides property; traditions and stories give it meaning. Families who research their roots, a pursuit covered in our genealogy and DNA testing statistics, often find that the conversation about heirlooms starts with the family tree.
Downsizing, storage and the belongings left behind
The most-quoted heirloom statistic of 2026 is an unfavorable one: nearly half of Americans would rather inherit nothing than sort through a relative’s belongings. Read with the rest of the data, it describes a wish for fewer, better things rather than a rejection of family history.
- 71.
49% of Americans say they would rather inherit nothing at all than take on the task of sorting a relative’s belongings (2026).
- 72.
58% of Americans have cleared out a relative’s home, and 56% of them say the sheer volume of belongings made it harder to grieve (2026).
- 73.
17 days is how long Americans estimate it would take to clear a relative’s home, compared with 14 days for their own (2026).
- 74.
59% of Americans feel guilt or obligation to keep family items (2026).
- 75.
10% of the categories self-storage users report storing are sentimental items and family heirlooms; 26% of survey respondents currently rent a unit (2026, 1,430 respondents).
Storage, estate sales and move managers
- 76.
48% of storage renters keep items connected to a past relationship or life chapter (2026).
- 77.
46% of Americans who have moved out still use their parents’ home as personal storage, and preservation and safekeeping is the top reason (41%) for storing belongings there (2026).
- 78.
26.4% of Americans surveyed say they keep stored belongings because they want to pass them down someday (2026).
- 79.
120,000 estate sales a year are advertised on EstateSales.net, a leading listing site for the trade (2025).
- 80.
1,000+ professionals belong to the National Association of Senior & Specialty Move Managers, which helps older adults downsize and decide what to keep (2026).
What this means
Clearing a home is easier when the meaningful pieces have been named in advance. Parents who choose a handful of objects for each child, and say why, spare their heirs the guilt that 59% of Americans already feel about family belongings.
Antiques, vintage and family collections
Objects that leave one family often find another. Antique and vintage shops are most common in the rural North, designers are sourcing more antiques than in years, and collectors overwhelmingly keep what they inherit.
- 81.
19,466 used-merchandise stores, the category that includes antique shops, vintage and consignment stores, operated in the United States in 2023, employing 222,478 people.
- 82.
13.9 used-merchandise stores per 100,000 residents make Vermont the leader, 2.4 times the national rate of 5.8, ahead of Montana (12.0), South Dakota (11.0) and Maine (10.8) (2023).
— U.S. Census Bureau; Gustavo Athayde analysis
- 83.
36% of the items interior designers sourced for a project in 2025 were vintage or antique, the highest share since 2021 (468 design professionals worldwide).
— 1stDibs
- 84.
63% of interior designers now use antiques made before the 1920s, up from 56% in 2024 (1stDibs survey of 468 designers, 2025).
— 1stDibs
- 85.
36% of secondhand shoppers buy pre-loved goods to find unique or collectible pieces (2025, 16,000 consumers in nine countries including the U.S.), and 86% of eBay sellers source inventory from their own belongings (11,000 sellers in ten markets).
— eBay
Collectors and family collections
- 86.
$78.8 billion is the projected size of the U.S. secondhand apparel market by 2030 (projection, 2026).
- 87.
Almost 90% of high-net-worth art collectors have kept the works they inherited (2026, 3,100 collectors in 10 markets including the U.S.).
- 88.
28% of collectors began collecting through family influence, the most common route, rising to 40% among Gen Z; 14% started with a family collection (2026).
- 89.
5.5 million weekly viewers across TV, streaming and social media watch PBS’s Antiques Roadshow, which marks its 30th season in 2026.
- 90.
46% of uninsured affluent young collectors mistakenly believe homeowners insurance covers their valuables; fewer than half have insured their collections (2025).
— Chubb
What this means
A piece with a documented history is worth more to the next owner, and to the next generation. Marking it, whether with a family seal on the letters that come with it or with engraved initials, keeps its story attached.
The craftsmen and family firms behind heirlooms
Heirlooms depend on the people who make and repair them. Jewelers, watchmakers, upholsterers and quilters keep old pieces in use, and a third of jewelers work for themselves.
- 91.
32,800 jewelers and precious stone and metal workers held jobs in the United States in 2025, at a median annual wage of $52,540.
- 92.
32% of jewelers are self-employed, nearly as many as work for jewelry, luggage and leather goods retailers (35%) (2025).
- 93.
3,700 openings for jewelers are projected each year through 2035 as artisans retire or change careers, even as overall employment edges down 3% (projection).
- 94.
1,400 watch and clock repairers work in the United States, at a median annual wage of $67,230 (2025).
- 95.
22,700 upholsterers (median wage $46,340) and 15,900 furniture finishers (median $44,540) keep family furniture in use (2025).
Family firms and preservation
- 96.
3,168 reupholstery and furniture repair shops operated in the United States in 2023, employing 10,920 people.
- 97.
1,844 jewelry and silverware manufacturing establishments employed 19,188 people in 2023.
- 98.
9 million to 11 million people actively quilt, a number steady for a decade, supporting a $4.5 billion North American quilting industry; the average quilter is a woman in her 60s (2025).
- 99.
27.3% of U.S. employer firms were family-owned in 2021, and they employed 42.3 million workers, 34.1% of all employment at employer firms.
- 100.
121,000+ veterans’ collections of letters, photographs and oral histories are preserved in the Library of Congress Veterans History Project, created by Congress in 2000 (2026).
What this means
Craft keeps heirlooms alive: a ring resized, a chair recovered, a quilt mended. The same idea guides a bespoke monogram: a symbol drawn once, with care, so that it can be used for generations.
Methodology
We collected about 120 candidate statistics and published the 100 best supported, each verified against the original page. Official data come from the Census Bureau (American Community Survey 2025 1-year, Table B25038; County Business Patterns 2023; Vintage 2024 and 2025 population estimates), the Federal Reserve, the IRS Statistics of Income program, the Bureau of Labor Statistics and the Bureau of Economic Analysis.
Items marked Atelier Analysis are our own calculations from public data. The state ranking divides households whose householder moved in during 1989 or earlier by all occupied units; margins of error were combined by the Census Bureau’s approximation for derived proportions, and differences smaller than the combined margin are reported as ties. Store rates divide 2023 establishment counts by 2023 population. Spending growth from 2015 to 2025 is in current dollars.
Several heirloom surveys are online polls commissioned by companies; we name each sponsor and sample. Columns in the object and generation tables come from different surveys and are not directly comparable. Projections are labeled. The comparisons are descriptive and do not establish causes.
About the author

Gustavo Athayde — Founder & Creative Director, GUSTAVO ATHAYDE
Gustavo Athayde is the founder and creative director of GUSTAVO ATHAYDE, a bespoke monogram atelier based in Sioux Falls, South Dakota. A graphic designer by training, he creates monograms, personal and family crests, heraldic emblems, signet designs and wax seals for individuals, families, couples and brands across the United States. Every commission is refined line by line into a symbol meant to be kept, used and passed down.
Follow the atelier on Instagram · Request a private consultation
Frequently asked questions
- What is the most commonly inherited family heirloom?
- Photo albums are the most common, inherited by 26% of adults in a 2026 survey of the U.S., Canada and Australia, followed by clothing and jewelry at 25% each.
- Do younger generations want family heirlooms?
- Yes, selectively: 51% of Americans prefer a few meaningful items to everything a relative owned, and 39% of Gen Z plan to leave an inheritance themselves.
- What heirloom do Americans most hope to inherit?
- An engagement ring tops the list at 32%, ahead of other jewelry (29%) and a wedding ring or watch (26% each), according to a 2020 survey.
More questions about heirlooms and inheritance
- Which state has the most long-held family homes?
- Hawaii, where 14.1% of households have lived in the same home since 1989 or earlier, statistically tied with West Virginia at 13.5% (ACS 2025).
- How many Americans have a will?
- About a quarter: 24% in a 2025 Caring.com survey, down from 33% in 2022; Gallup found 46% in 2021 using a different question.
- How much wealth will Americans pass down?
- Cerulli Associates projects $124 trillion in transfers through 2048, of which $105 trillion is expected to go to heirs and $18 trillion to charity.
Cite this page
Source: Gustavo Athayde, "Family Heirloom Statistics 2026", https://gustavoathayde.com/family-heirloom-statistics/Feel free to use these statistics and charts — we just ask for a link back to this page.
Sources
- Changes in U.S. family finances from 2022 to 2025 (SCF Bulletin) (Federal Reserve Board)
- Characteristics of family-owned businesses (fact sheet) (SBA Office of Advocacy)
- County Business Patterns 2023 (state and U.S. files) (U.S. Census Bureau)
- Economic Brief 26-19: family transfers in 2024 (Federal Reserve Bank of Richmond)
- Informal support networks in the Survey of Consumer Finances (FEDS Notes, Oct. 2026) (Federal Reserve Board)
- Occupational Outlook Handbook: Jewelers and precious stone and metal workers (U.S. Bureau of Labor Statistics)
- Occupational Outlook Handbook: Woodworkers (furniture finishers) (U.S. Bureau of Labor Statistics)
- Participate in the Veterans History Project (Library of Congress)
- Personal consumption expenditures: jewelry and watches (BEA, via FRED) (U.S. Bureau of Economic Analysis)
- SOI Tax Stats: estate tax returns filed in 2024 (Tables 1 and 4) (Internal Revenue Service)
- Tenure by year householder moved into unit, Table B25038 (ACS 2025 1-year) (U.S. Census Bureau)
- Upholsterers (51-6093.00) (O*NET OnLine (BLS data))
- Vintage 2025 population estimates (press release) (U.S. Census Bureau)
- Watch and clock repairers (49-9064.00) (O*NET OnLine (BLS data))
Consumer surveys and polls
- Estate Planning Report 2025: defining legacy (Trust & Will)
- Family recipes bind generations together at Thanksgiving tables (survey for Jennie-O) (Talker Research)
- Generation X and heirlooms (Mover Insights Study 2018) (Mayflower)
- Great Junk Transfer, 2026 study (full report) (1-800-GOT-JUNK?)
- Holiday traditions survey for the Archbridge Institute (2022) (The Harris Poll)
- How many Americans have a will? (Gallup)
- Leaving a Legacy: a lasting gift to loved ones (press release) (Merrill Lynch and Age Wave)
- Legacy and love take priority for aging Americans (survey for Ethos) (Talker Research)
- LegalShield Make-A-Will Month survey (2025) (LegalShield)
- Many heirs can't afford an inherited home (reporting a LegalZoom survey of 2,000 U.S. adults) (Kiplinger)
- More Americans expect to leave an inheritance, fewer anticipate getting one (401(k) Specialist)
- Most people have a family heirloom that is decades old (OnePoll survey for Shinola) (SWNS via BIN News)
- Most sentimental U.S. states, 2026 survey (Mixbook)
- Nearly all parents of adult children saved childhood photos and art (YouGov)
- Nearly half of Americans would rather inherit nothing (survey for 1-800-GOT-JUNK?) (Talker Research)
- Nostalgia is keeping Americans from clearing out their parents' homes (survey for CubeSmart) (Talker Research)
- Other life in storage, 2026 survey (SpareFoot)
- Planning & Progress Study 2025: Leaving a Legacy (Northwestern Mutual)
- Purge deficit: why Americans keep storing belongings (survey for CubeSmart) (Talker Research)
- Self-storage demand and trends 2026 (StorageCafe)
- Something old or something new: how wedding trends are changing in the US (De Beers (A Diamond Is Forever))
- What do Americans want to inherit? (Trust & Will)
- Will and Estate Planning Survey 2025 (Caring.com)
- Your fancy plates deserve better: why homeowners are finally using them (survey for SMEG USA) (Talker Research)
Industry, market and financial research
- Antiques Roadshow press and media (PBS / GBH)
- Art Basel and UBS Survey of Global Collecting 2026 (Art Basel and UBS)
- Cerulli anticipates $124 trillion in wealth will transfer through 2048 (Cerulli Associates)
- Chubb survey: young luxury collectors buy for investment, more than half uninsured (Chubb)
- eBay Recommerce Report 2025 (eBay)
- Engagement ring insurance survey (May 2026) (Jewelers Mutual)
- Global Wealth Report 2025 (press release) (UBS)
- Gold Demand Trends full year 2025 (World Gold Council)
- Gold Demand Trends full year 2025: jewellery (World Gold Council)
- Interior design trends for 2026: 1stDibs designer survey (1stDibs)
- Jewelry buying consumer study (2024) (Jewelers Mutual)
- Press kit (National Association of Senior & Specialty Move Managers)
- Size of the quilting market: Quilting Trends Survey results 2025 (Craft Industry Alliance)
- Swiss watch exports 2025 (Federation of the Swiss Watch Industry)
- Swiss Watch Industry Study 2025 (Deloitte)
- ThredUp 14th annual Resale Report (2026) (ThredUp and GlobalData)
- Why budget-conscious consumers are hitting up estate sales (Modern Retail)