
100 Great Wealth Transfer Statistics 2026: Who Holds America’s Wealth and Who Inherits
The Great Wealth Transfer is no longer a forecast; it has begun. Our analysis of Federal Reserve data shows that Baby Boomers hold $97.4 trillion, or 52.5% of U.S. household wealth, but their share has slipped from 57.4% at the end of 2016, and the Silent Generation now holds just 10.7%, down from 80% in 1989. Cerulli Associates projects $124 trillion in transfers through 2048.
These Great Wealth Transfer statistics bring together 100 figures from the Federal Reserve, the Census Bureau, the IRS and leading surveys, including an original ranking of the states where owners 65 and older hold the largest share of home wealth.
At a glance
Key takeaways
- $124 trillion is projected to change hands through 2048; $105 trillion to heirs and $18 trillion to charity.
- Baby Boomers hold $97.4 trillion, 52.5% of household wealth, down from 57.4% at the end of 2016.
- 63.1% of U.S. wealth belongs to Boomers and the Silent Generation combined.
- Millennials and Gen Z hold 11.2%, more than Gen X held at the same stage of life (9.7%).
- 33.6% of household wealth is held by households 70 and older, up from 18.9% in 1989.
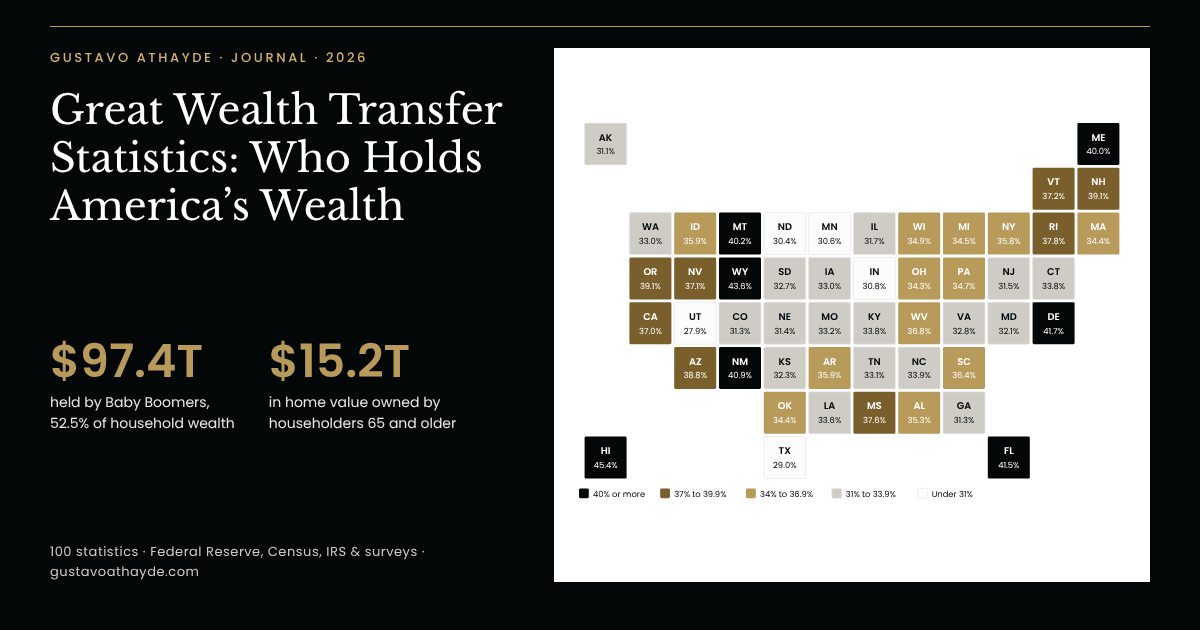
- Hawaii leads our Home Wealth Handoff ranking at 45.4%; Utah is lowest at 27.9%.
- $54 trillion will pass first between spouses, more than 95% of it to women.
- 56% of U.S. adults have no estate planning documents.
- $62.19 billion reached charities through bequests in 2025, up 19.7%.
- $15 million per person is the 2026 federal estate tax exemption, now permanent.
How big is the Great Wealth Transfer?
The phrase “Great Wealth Transfer” describes the handoff of assets built by the Baby Boomers and their parents. The projections differ by scope and horizon, but they agree on scale: tens of trillions of dollars will move to spouses, children, grandchildren and charities over the next two decades.
- 1.
$124 trillion in U.S. wealth is projected to change hands through 2048: $105 trillion to heirs and $18 trillion to charity, according to Cerulli Associates’ latest estimate (published December 2024).
- 2.
81% of those transfers, nearly $100 trillion, will come from Baby Boomers and older generations (Cerulli projection, 2024).
- 3.
$62 trillion, more than half of the projected transfers, is expected to come from high-net-worth and ultra-high-net-worth households, which make up only 2% of U.S. households (Cerulli, 2024).
- 4.
More than $29 trillion is expected to pass between generations and spouses in the United States over the next 20 to 25 years, the largest volume of any country, out of more than $83 trillion worldwide (UBS Global Wealth Report 2025).
— UBS
- 5.
$195.9 trillion was the net worth of U.S. households and nonprofit organizations in the second quarter of 2026, after a gain of $12.8 trillion in a single quarter (Federal Reserve, Financial Accounts).
A nation still building wealth
The transfer is not a fixed sum waiting to be divided. American households keep adding to it, and the United States continues to create more millionaires than any other country.
- 6.
$185.7 trillion was held by U.S. households in mid-2026 in the Fed’s distributional accounts, up 11.9% from $165.9 trillion a year earlier (Q2 2026).
— Federal Reserve Board; Gustavo Athayde analysis
- 7.
63.1% of U.S. household wealth, $117.2 trillion, belongs to Baby Boomers and the Silent Generation, the two generations whose estates will drive the transfer (Q2 2026).
— Federal Reserve Board; Gustavo Athayde analysis
- 8.
More than 440,000 Americans became millionaires in 2025, almost half of all new millionaires in the world (UBS Global Wealth Report 2026).
— UBS
- 9.
8.7 million Americans had at least $1 million in investable assets in 2025 after the U.S. added 736,000, more than any other market (Capgemini World Wealth Report 2026).
What this means
The larger the estate, the more it depends on clear instructions. Families who plan the handoff of money tend to plan the handoff of meaning as well, a theme we explored in our family heirloom statistics.
Great Wealth Transfer statistics by generation
The Federal Reserve’s Distributional Financial Accounts track household wealth by generation every quarter since 1989. Our analysis of the latest release, covering the second quarter of 2026, shows a handoff already in motion: the Silent Generation’s share has shrunk to a tenth of the total, and the Boomers’ share has passed its peak.
Three decades of wealth by generation
- 10.
$97.4 trillion, or 52.5% of U.S. household wealth, is held by Baby Boomers (born 1946 to 1964), the largest share of any generation (Q2 2026).
- 11.
$47.7 trillion, or 25.7%, is held by Gen X (born 1965 to 1980), the generation Cerulli expects to inherit the most over the next decade (Q2 2026).
- 12.
$20.8 trillion, or 11.2%, is held by Millennials and Gen Z (born 1981 or later) (Q2 2026).
- 13.
$19.8 trillion, or 10.7%, is still held by the Silent Generation and earlier (born before 1946), down from 80.1% of household wealth in 1989.
— Federal Reserve Board; Gustavo Athayde analysis
- 14.
57.4% was the Baby Boomers’ share of U.S. household wealth at the end of 2016; by mid-2026 it had eased to 52.5% as wealth began moving to younger households.
— Federal Reserve Board; Gustavo Athayde analysis
Wealth at the same stage of life
- 15.
8.8 times: the growth in the net worth of Millennials and Gen Z since the end of 2016, from $2.4 trillion to $20.8 trillion (Q2 2026).
— Federal Reserve Board; Gustavo Athayde analysis
- 16.
11.2% of U.S. wealth is held by Millennials and Gen Z today, when the middle of the generation is about 37; Gen X held 9.7% at the same stage (2010), and Boomers held 23.4% (1992).
— Federal Reserve Board; Gustavo Athayde analysis
- 17.
$12.2 trillion was added to Baby Boomer net worth in the 12 months to mid-2026, a gain of 14.4% (Q2 2025 to Q2 2026).
— Federal Reserve Board; Gustavo Athayde analysis
What the Boomers own
- 18.
54.5% of the corporate equities and mutual fund shares held by U.S. households outside pension and retirement plans belongs to Baby Boomers, $35.2 trillion (Q2 2026).
— Federal Reserve Board; Gustavo Athayde analysis
- 19.
61.1% of household equity in noncorporate (unincorporated) businesses, $10.2 trillion, belongs to Baby Boomers and the Silent Generation; the category includes many family firms as well as rental real estate (Q2 2026).
— Federal Reserve Board; Gustavo Athayde analysis
- 20.
42.6% of household debt is carried by Millennials and Gen Z, the generation now in its home-buying years, against 20.8% for Boomers (Q2 2026).
— Federal Reserve Board; Gustavo Athayde analysis
Wealth by generation at a glance
Generation (born) Net worth Percent of total Home real estate Stocks and funds Noncorporate business Silent and earlier (before 1946) $19.8T 10.7% 7.6% 14.1% 10.4% Baby Boomers (1946–1964) $97.4T 52.5% 41.3% 54.5% 50.8% Gen X (1965–1980) $47.7T 25.7% 28.7% 22.1% 25.1% Millennials and Gen Z (1981 or later) $20.8T 11.2% 22.4% 9.3% 13.8%
Q2 2026. Source: Federal Reserve, Distributional Financial Accounts; shares calculated by Gustavo Athayde from the Fed’s levels. The Fed groups Gen Z with Millennials. The last four columns show each generation’s percentage of the U.S. total.
What this means
More than half of the stocks and noncorporate business equity held by American households sit with one generation. Each of those holdings will need a named successor, and for family firms the question is as much about stewardship as about tax. A family crest has long served the same purpose: marking what one generation hands to the next.
Wealth by age: the families who will pass it on
Measured by age rather than generation, the picture is just as clear. Households headed by someone 70 or older now hold a record share of the nation’s wealth, and the Fed’s newest Survey of Consumer Finances shows the oldest families with the highest median net worth.
- 21.
33.6% of U.S. household wealth, $62.3 trillion, is held by households headed by someone 70 or older, up from 18.9% in 1989 (Q2 2026).
- 22.
41.0% is held by households aged 55 to 69, the largest share of any age group (Q2 2026).
- 23.
74.5% of household wealth, $138.4 trillion, belongs to households headed by someone 55 or older (Q2 2026).
— Federal Reserve Board; Gustavo Athayde analysis
- 24.
6.5% of household wealth is held by households headed by someone under 40, compared with 12.0% in 1989 (Q2 2026).
- 25.
40.5% of the corporate stock and mutual funds held outside workplace retirement plans belongs to households 70 and older (Q2 2026).
What the 2025 Survey of Consumer Finances shows
- 26.
$215,900 was the median net worth of U.S. families in 2025, up 2% from 2022 after inflation; the mean rose 7% to $1.24 million (Survey of Consumer Finances).
- 27.
$504,900 was the median net worth of families headed by someone 75 or older in 2025, the highest of any age group in the Fed’s survey.
- 28.
$431,300 was the median for families aged 65 to 74 and $411,900 for ages 55 to 64, against $155,600 for families aged 35 to 44 (2025).
- 29.
66% of U.S. families owned their home in 2025, and the median net housing value for owners rose to $230,000 from $218,900 in 2022 (Survey of Consumer Finances).
- 30.
85.4% of U.S. families belong to an informal network of relatives and friends that shares money or caregiving, a quiet transfer that happens long before any will is read (2025 Survey of Consumer Finances).
What this means
Wealth peaks late in life, and much of it is already shared informally: help with a down payment, tuition, or care for a parent. Those gifts during life are part of the transfer too, and they are often the ones families remember.
The Home Wealth Handoff: a state ranking
The family home is the asset most Americans will inherit. To see where that handoff is largest, we ranked every state by the share of owner-occupied home value held by householders 65 and older, using the Census Bureau’s 2025 American Community Survey. We call it the Home Wealth Handoff ranking. Differences smaller than the combined margin of error are treated as statistical ties.
The map of the Home Wealth Handoff
SHARE THIS CHART
Copy the code below to embed this chart on your site:
- 31.
$15.2 trillion in owner-occupied home value, 34.9% of the U.S. total, belongs to householders 65 and older, according to the Census Bureau’s 2025 American Community Survey.
— U.S. Census Bureau; Gustavo Athayde analysis
- 32.
Hawaii leads our Home Wealth Handoff ranking: householders 65 and older hold 45.4% of the state’s owner-occupied home value, statistically tied with Wyoming at 43.6% (2025).
— U.S. Census Bureau; Gustavo Athayde analysis
- 33.
Delaware (41.7%), Florida (41.5%) and New Mexico (40.9%) follow; seven states have at least 40% of home value in the hands of owners 65 and older (2025).
— U.S. Census Bureau; Gustavo Athayde analysis
Where the most value sits
- 34.
$2.88 trillion in California homes and $1.38 trillion in Florida homes belong to owners 65 and older; the two states hold 28% of the national total (2025).
— U.S. Census Bureau; Gustavo Athayde analysis
- 35.
Utah (27.9%) and Texas (29.0%) have the lowest shares; both are among the states with the youngest and fastest-growing populations (2025).
— U.S. Census Bureau; Gustavo Athayde analysis
- 36.
17 states sit statistically above the national share of 34.9% and 22 below it; the remaining 11 are within the margin of error (2025).
— U.S. Census Bureau; Gustavo Athayde analysis
- 37.
13.7 million owner-occupied homes, 15.6% of the total, are headed by someone 75 or older; Hawaii has the highest share at 22.1% (2025).
— U.S. Census Bureau; Gustavo Athayde analysis
Homes, equity and the next owners
- 38.
79.1% of householders 65 and older owned their home in the third quarter of 2026, against 36.6% of those under 35 and 65.5% nationally.
- 39.
$35.8 trillion was homeowners’ equity in U.S. real estate in the second quarter of 2026 (Federal Reserve).
— Federal Reserve Bank of St. Louis (FRED), from Federal Reserve Z.1
- 40.
26% of America’s $48 trillion in real estate wealth was held by Americans 70 and older in the third quarter of 2025, up from 21.6% a decade earlier (Redfin analysis, 2025).
— Redfin
- 41.
9.2 million fewer Baby Boomer homeowner households are projected by 2035, homes that will pass to heirs or new buyers (Freddie Mac projection, 2024).
- 42.
23.8% of young Americans who recently bought a home used family money for the down payment, and about 11% used an inheritance (Redfin survey, 2025).
— Redfin
Full ranking: states 1 to 25
Rank State Share held by owners 65+ MOE (pts) Value held by owners 65+ Homes headed by 75+ 1 Hawaii 45.4% ±0.9 $146.9B 22.1% 2 Wyoming * 43.6% ±4.6 $43.9B 14.8% 3 Delaware 41.7% ±1.2 $57.0B 17.4% 4 Florida 41.5% ±0.5 $1,377.3B 19.7% 5 New Mexico 40.9% ±0.9 $84.2B 16.9% 6 Montana 40.2% ±2.0 $72.3B 17.1% 7 Maine 40.0% ±1.4 $81.1B 16.0% 8 New Hampshire 39.1% ±2.5 $88.0B 15.2% 9 Oregon 39.1% ±0.7 $242.0B 17.9% 10 Arizona 38.8% ±0.8 $408.2B 18.6% 11 Rhode Island 37.8% ±1.3 $64.8B 16.1% 12 Mississippi 37.6% ±4.5 $79.2B 15.7% 13 Vermont 37.2% ±2.1 $32.6B 16.5% 14 Nevada 37.1% ±1.0 $153.1B 15.8% 15 California 37.0% ±0.4 $2,882.6B 16.8% 16 West Virginia 36.8% ±0.8 $47.4B 18.0% 17 South Carolina 36.4% ±0.8 $246.7B 16.6% 18 Arkansas 35.9% ±2.5 $89.6B 15.5% 19 Idaho 35.9% ±1.5 $108.5B 15.3% 20 New York 35.8% ±0.8 $979.2B 16.6% 21 Alabama 35.3% ±0.9 $155.5B 16.1% 22 Wisconsin 34.9% ±0.8 $226.0B 14.8% 23 Pennsylvania 34.7% ±0.6 $458.0B 15.7% 24 Michigan 34.5% ±0.5 $341.5B 15.4% 25 Massachusetts 34.4% ±0.8 $471.0B 15.8%
Full ranking: states 26 to 50
Rank State Share held by owners 65+ MOE (pts) Value held by owners 65+ Homes headed by 75+ 26 Oklahoma 34.4% ±0.8 $102.2B 15.2% 27 Ohio 34.3% ±0.8 $349.6B 15.8% 28 North Carolina 33.9% ±0.8 $433.2B 15.5% 29 Connecticut 33.8% ±1.2 $186.1B 16.1% 30 Kentucky 33.8% ±0.7 $122.1B 15.1% 31 Louisiana 33.6% ±0.9 $116.7B 15.7% 32 Missouri 33.2% ±0.5 $193.2B 15.0% 33 Tennessee 33.1% ±0.7 $283.4B 15.5% 34 Iowa 33.0% ±0.9 $90.2B 14.8% 35 Washington 33.0% ±0.8 $502.5B 14.5% 36 Virginia 32.8% ±0.5 $408.8B 15.2% 37 South Dakota 32.7% ±1.4 $28.7B 13.6% 38 Kansas 32.3% ±0.7 $79.1B 15.0% 39 Maryland 32.1% ±0.3 $279.5B 14.7% 40 Illinois 31.7% ±0.8 $396.2B 15.1% 41 New Jersey 31.5% ±0.5 $452.8B 15.4% 42 Nebraska 31.4% ±1.2 $55.5B 14.2% 43 Colorado 31.3% ±0.5 $354.5B 13.3% 44 Georgia 31.3% ±0.7 $369.6B 14.0% 45 Alaska 31.1% ±2.2 $24.5B 11.5% 46 Indiana 30.8% ±0.4 $183.9B 14.1% 47 Minnesota 30.6% ±0.5 $212.2B 13.5% 48 North Dakota 30.4% ±2.5 $21.2B 12.5% 49 Texas 29.0% ±0.5 $849.0B 12.5% 50 Utah 27.9% ±0.9 $148.8B 11.9%
About the ranking data
Rank = aggregate value of owner-occupied homes whose householder is 65 or older ÷ aggregate value of all owner-occupied homes, ACS 2025 1-year estimates, Table B25079; margins of error at 90%, derived with the Census Bureau’s formula for ratios. * = statistically tied with the leader. Last column: Table B25007, owner-occupied units with a householder 75 or older ÷ all owner-occupied units. United States: 34.9% (±0.1), $15.2 trillion, 15.6%. District of Columbia: 32.8%, not ranked. Values are owners’ estimates of market value. Source: U.S. Census Bureau; Gustavo Athayde analysis.
What this means
Where older owners hold most of the home value, the house is likely to be the centerpiece of the estate, and often the place where a family’s history is kept. In younger states such as Utah and Texas, more of that value already belongs to the families raising children there. Our multigenerational households ranking shows where several generations already share one roof.
Inheritances and estates today
Inheritances are common but modest for most families, and the federal estate tax now reaches only a few thousand of the largest estates each year. The higher exemption written into law in 2025 gives family farms and businesses more certainty about what they can pass on.
- 43.
19% of U.S. families aged 48 to 62 had ever received an inheritance as of 2022, the latest Federal Reserve data on inheritances.
- 44.
$110,000 was the mean value of inheritances, counted as if invested, among all families aged 48 to 62 in 2022, equal to 8.3% of their net worth (Federal Reserve).
- 45.
7,195 federal estate tax returns were filed in 2024, down 20% from 9,024 in 2023, as the exemption rose (IRS Statistics of Income).
- 46.
$23.3 billion in net estate tax was reported on returns filed in 2024, down more than 47.5% from 2023.
- 47.
Nearly 57% of the assets reported by estate tax decedents in 2024 were stocks and real estate.
- 48.
California filed the most estate tax returns in 2024, followed by Florida, New York, Texas and Illinois; Wyoming filed the most per 100,000 adults.
Estate and gift tax rules in 2026
- 49.
$15 million per person, $30 million for a married couple, is the federal estate tax exemption for 2026, up from $13.99 million in 2025 and made permanent by the tax law signed on July 4, 2025.
- 50.
$19,000 per recipient can be given in 2026 without filing a gift tax return, unchanged from 2025 (IRS annual exclusion).
- 51.
$32 billion was collected from federal estate and gift taxes in fiscal 2024, 0.8% of federal revenue; the top rate is 40%, down from 55% in 2000 (Congressional Research Service).
- 52.
0.3% of the 41,104 estates left by farm operators in 2024, about 141, were expected to owe federal estate tax (USDA estimate).
What this means
With the exemption at $15 million, most families will never owe estate tax. Their larger task is practical: deciding who receives the home, the business and the objects that carry the family’s story, and writing it down.
Who will inherit, and how prepared they are
Much of the wealth will move twice: first to a surviving spouse, usually a wife, and later to children and grandchildren. Surveys show heirs are counting on it, and many parents have not yet told them what to expect.
- 53.
$54 trillion is projected to pass first between spouses before reaching the next generation, and more than 95% of it will go to women (Cerulli, 2024–2025).
- 54.
$46 trillion will go to Millennials over the next 25 years, the most of any generation, while Gen X stands to receive $14 trillion in the next 10 years against $8 trillion for Millennials (Cerulli projection, 2024).
- 55.
20% of U.S. adults expected to receive an inheritance in 2025, down from 25% a year earlier, while 31% expected to leave an inheritance or charitable gift, up from 26% (Northwestern Mutual, 4,626 adults).
- 56.
30% of Gen Z expect to receive an inheritance, compared with 26% of Millennials, 20% of Gen X and 9% of Boomers and older (2025).
- 57.
69% of Millennials who expect an inheritance call it critical to their long-term financial security (57% of all heirs-to-be, 2025).
Are the heirs ready?
- 58.
46% of Americans expect to receive an inheritance, and half of them have never formally discussed it with the person leaving it (Trust & Will survey of 5,000 adults, 2026).
- 59.
76% of the next generation want to know whether they are named as a beneficiary, but only 35% of Baby Boomers feel a need to tell them (Fidelity, affluent families, 2025).
- 60.
95% of adult children in affluent families say they are ready to manage inherited wealth; 25% of their parents disagree (Fidelity, 2025).
- 61.
36% of ultra-high-net-worth Americans ($25 million or more) say their heirs are very prepared for their inheritance (Bank of America, 2026).
- 62.
81% of inheritors worldwide plan to switch wealth management firms within one to two years of inheriting (Capgemini World Wealth Report, 2025).
What this means
Preparation is the gift that protects every other gift. Families who talk early tend to keep both the assets and the relationships. Our statistics on the marriages that last longest are a reminder of how much of this handoff begins with a spouse.
Wills, trusts and family conversations
Most Americans still have no will, and the share has fallen in recent surveys. Different questions produce different answers, so we use the newest large survey as our main figure and note the others in the FAQ.
- 63.
56% of U.S. adults have none of the five core estate planning documents, such as a will or trust (Trust & Will survey of 5,000 adults, 2026).
- 64.
26% of Americans had a will in 2026, down from 31% in 2025, while trust ownership rose from 11% to 14% (Trust & Will).
- 65.
62% of Gen X have no estate documents, more than Gen Z (54%), Millennials (58%) or Baby Boomers (48%) (2026).
- 66.
40% of homeowners have a will, more than double the 16% rate among renters (Trust & Will, 2026).
- 67.
41% of Americans say memories and relationships will be their most meaningful legacy, ahead of financial assets and property at 22% each (2026).
The family conversation
- 68.
43% of Americans without a will say they “just haven’t gotten around to it” (Caring.com survey of 2,500+ adults, 2025).
- 69.
70% of affluent parents 55 and older have a will or estate plan, but 68% have not shared inheritance details with their children (Fidelity, 2025).
- 70.
60% of Americans who plan to leave an inheritance have talked with their family about it, and 64% call leaving one their top or a very important financial goal (Northwestern Mutual, 2025).
- 71.
58% of Millennials fear family conflict over an inheritance more than taxes or other financial worries (LegalShield survey, 2025).
- 72.
$4.1 million is the average amount wealthy Americans who plan to pass on wealth expect to distribute; 57% have a will and 34% a trust (Schwab survey of 1,005 investors, 2024).
What this means
A will divides property; a conversation explains it. Naming the pieces that matter, from a ring to a signet engraved with the family’s initials, spares heirs from guessing and keeps the story attached to the object.
Family businesses and succession
Family enterprise is where the transfer meets the real economy. Many owners near retirement want to keep the business in the family, yet few have written down how that will happen.
- 73.
52% of U.S. employer businesses with a reported owner age were owned by people 55 or older, including 21.6% owned by people 65 and older (Census Annual Business Survey, 2020 data).
- 74.
23% of wealthy business owners surveyed in 2026 said they inherited their business, up from 11% in 2024 and 5% in 2022 (Bank of America, 1,431 Americans with $3 million or more).
- 75.
78% of wealthy business owners call succession planning important, but only 20% have a fully documented plan (Bank of America study, 2026).
— Fortune
- 76.
9% of Baby Boomer business owners have an estate plan, and only 5% have a dedicated exit-planning team (Exit Planning Institute, 2025).
- 77.
27% of Baby Boomer business owners have had a formal valuation, although more than half plan to exit within five years (2025).
Keeping it in the family
- 78.
44% of U.S. family firms say succession planning affected their business in the past year, compared with 34% globally (PwC US Family Business Survey, 2025).
— PwC
- 79.
54% of business owners aim to pass their company to a family member, and over half put preserving its legacy and values ahead of financial considerations (ideas42 survey, 2025).
- 80.
43% of billionaire parents in a UBS survey of 87 clients worldwide hope their children will carry on and grow the family business, and more than eight in ten want them to succeed independently (UBS, 2025).
— UBS
- 81.
30%, 13% and 3%, the often-quoted survival rates of family firms into the second, third and fourth generations, trace to a 1987 study of 200 Illinois manufacturers that counted any sale or merger as a failure (historical).
What this means
The most durable family firms pair a succession plan with a shared identity: a name, a mark and a set of values the next generation chooses to carry. That identity is what a brand monogram is designed to hold.
Bequests and legacy giving
Charities are already feeling the transfer. Bequest giving has grown faster than any other source of American philanthropy, and Cerulli expects $18 trillion to reach charity through 2048.
- 82.
$617.20 billion was given to U.S. charities in 2025, the first year American giving passed $600 billion (Giving USA 2026).
— Giving USA Foundation and IU Lilly Family School of Philanthropy
- 83.
$62.19 billion reached charities through bequests in 2025, up 19.7%, or 16.6% after inflation, the fastest growth of any source of giving.
— Giving USA Foundation and IU Lilly Family School of Philanthropy
- 84.
10.1% of all U.S. charitable giving in 2025 came through bequests ($62.19 billion of $617.20 billion).
— Giving USA Foundation and IU Lilly Family School of Philanthropy; Gustavo Athayde analysis
- 85.
Three of the past four years have seen bequest giving rise 20% or more, a sign that the transfer is already reaching charities (Philanthropy Roundtable, 2026).
Lifetime generosity
- 86.
$394.20 billion was given by living individuals in 2025, still the largest source of American giving by a wide margin (Giving USA 2026).
- 87.
$326 billion was held in donor-advised funds in 2024, up from $250 billion a year earlier, and DAFs granted $64.9 billion to charities (Annual DAF Report 2025).
- 88.
$18.3 billion in grants was recommended by Fidelity Charitable donors in 2025 (2026 Giving Report).
- 89.
62.7% of families in the top wealth tenth that take part in family support networks give money to others, against 37.8% in the bottom tenth (2025 Survey of Consumer Finances).
What this means
A bequest is often the last chapter of a lifetime of giving. Families who involve children in their giving while they are alive tend to see those commitments continue.
Longevity, care and the timing of the transfer
Americans are living longer, so the transfer will unfold over decades rather than years. Longer lives mean more years of care to pay for, more help given to grandchildren along the way, and more wealth that passes first to a surviving spouse.
- 90.
80 is the age the oldest Baby Boomers reach in 2026; about 67 million Boomers were living in 2024, down from a peak of 79 million in 1999 (Pew Research Center).
- 91.
18.0% of Americans were 65 or older in 2024, up from 12.4% in 2004, and older adults outnumbered children in 11 states (Census Bureau).
- 92.
79.1 million people 65 or older are projected in the Social Security area population in 2040, up from 66.4 million in 2026 (Social Security Trustees, intermediate projection).
- 93.
3.09 million Americans died in 2025, according to provisional data, as the death rate fell to a record low of 689.2 per 100,000 (CDC).
- 94.
19.7 years was life expectancy at age 65 in 2024: 20.8 for women and 18.4 for men, which is why so much wealth passes first to widows (CDC).
Care costs and family support
- 95.
$129,575 a year was the national median cost of a private room in a nursing home in 2025, about $355 a day (CareScout Cost of Care Survey).
- 96.
$74,400 a year was the median cost of assisted living in 2025, up 5% (CareScout).
- 97.
$903 billion a year is what American grandparents contribute to their families, including $172 billion in direct financial support and the value of unpaid care (AARP Research, 2026).
- 98.
23% of grandparents spend money to support their grandchildren’s education and activities (AARP Research, 2026).
- 99.
51% of Americans aged 18 to 75 own life insurance, one of the simplest ways to pass on wealth; about 100 million lack adequate coverage (LIMRA and Life Happens, 2025).
- 100.
79% of American millionaires say their wealth is self-made and 12% say they inherited it; 53% expect to leave an inheritance or charitable gift (Northwestern Mutual, 2025).
What this means
Time is the variable most families underestimate. The years between retirement and inheritance are when grandparents shape a family’s traditions, and when a family seal or a written note can do as much as any account to say what should be kept.
Methodology
We collected about 120 candidate statistics and published the 100 best supported, each checked against the original page. Official data come from the Federal Reserve (Distributional Financial Accounts for Q2 2026, released September 18, 2026; Financial Accounts Z.1; the 2025 Survey of Consumer Finances), the Census Bureau (American Community Survey 2025 1-year, Tables B25079 and B25007; Housing Vacancies and Homeownership), the IRS, the CDC and the Social Security Administration.
Items marked Atelier Analysis are our own calculations. Generation and age shares divide each group’s net worth by the total in the Fed’s distributional accounts, which define Millennials as everyone born in 1981 or later. The life-stage comparison uses the year in which the middle birth year of each generation turned 37. The state ranking divides the aggregate value of owner-occupied homes held by householders 65 and older by the value of all owner-occupied homes; margins of error follow the Census Bureau’s formula for ratios, and differences smaller than the combined margin are reported as ties.
Wealth transfer totals from Cerulli, UBS and others are projections with different scopes and horizons, and are labeled as such. Several surveys are commissioned by financial firms; we name each sponsor and sample. The comparisons are descriptive and do not establish causes.
About the author

Gustavo Athayde — Founder & Creative Director, GUSTAVO ATHAYDE
Gustavo Athayde is the founder and creative director of GUSTAVO ATHAYDE, a bespoke monogram atelier based in Sioux Falls, South Dakota. A graphic designer by training, he creates monograms, personal and family crests, heraldic emblems, signet designs and wax seals for individuals, families, couples and brands across the United States. Every commission is refined line by line into a symbol meant to be kept, used and passed down.
Follow the atelier on Instagram · Request a private consultation
Frequently asked questions
- What is the Great Wealth Transfer?
- It is the handoff of assets from Baby Boomers and older Americans to spouses, heirs and charities; Cerulli Associates projects $124 trillion in U.S. transfers through 2048.
- How much wealth do Baby Boomers hold?
- Baby Boomers held $97.4 trillion in the second quarter of 2026, or 52.5% of U.S. household net worth, according to the Federal Reserve.
- Who will inherit the most?
- Spouses come first, with $54 trillion projected to pass between them; over 25 years Millennials receive the most ($46 trillion), while Gen X receives the most in the next decade.
More questions about inheritance and estates
- Which state has the most home wealth held by older owners?
- Hawaii, where householders 65 and older hold 45.4% of owner-occupied home value, statistically tied with Wyoming at 43.6% (ACS 2025).
- How many Americans have a will?
- About a quarter: 26% in Trust & Will’s 2026 survey and 24% in Caring.com’s 2025 survey; Gallup found 46% in 2021 using a different question.
- Will most families owe estate tax?
- No. Only 7,195 estate tax returns were filed in 2024, and the 2026 exemption is $15 million per person, or $30 million for a married couple.
Cite this page
Source: Gustavo Athayde, "Great Wealth Transfer Statistics 2026", https://gustavoathayde.com/great-wealth-transfer-statistics/Feel free to use these statistics and charts — we just ask for a link back to this page.
Sources
- American Community Survey 2025 1-year, Table B25007 (tenure by age of householder) (U.S. Census Bureau)
- American Community Survey 2025 1-year, Table B25079 (aggregate value by age of householder) (U.S. Census Bureau)
- Changes in U.S. Family Finances from 2022 to 2025 (Federal Reserve Bulletin) (Federal Reserve Board)
- Distributional Financial Accounts: Distribution of Household Wealth in the U.S. since 1989 (Federal Reserve Board)
- Federal estate taxes and farm estates (U.S. Department of Agriculture, Economic Research Service)
- FEDS Working Paper 2025-097 (Llanes, Thompson and Henriques Volz) (Federal Reserve Board)
- Financial Accounts of the United States (Z.1), Recent Developments, Q2 2026 (Federal Reserve Board)
- Households; Owners' Equity in Real Estate (OEHRENWBSHNO) (Federal Reserve Bank of St. Louis (FRED), from Federal Reserve Z.1)
- Housing Vacancies and Homeownership, Third Quarter 2026 (Table 6) (U.S. Census Bureau)
- Informal Support Networks in the Survey of Consumer Finances (FEDS Notes) (Federal Reserve Board)
- Mortality in the United States, 2024 (Data Brief 548) (CDC, National Center for Health Statistics)
- OASDI Trustees Report 2026, Table V.A3 (Social Security Administration)
- Older adults outnumber children in 11 states and nearly half of U.S. counties (U.S. Census Bureau)
- Older business owners (NSF 25-342), from the Census Annual Business Survey (National Science Foundation, NCSES)
- Provisional data: U.S. death rate fell to a record low in 2025 (CDC, National Center for Health Statistics)
- Publication 5332: Estate Tax Returns Filed in 2024 (Internal Revenue Service, Statistics of Income)
- Survey of Consumer Finances 2025 (press release, Oct. 9, 2026) (Federal Reserve Board)
- The Estate and Gift Tax: An Overview (IF12846) (Congressional Research Service)
- What's new: estate and gift tax (Internal Revenue Service)
Surveys of families, owners and investors
- America's largest wealth transfer faces an unexpected obstacle (LegalShield)
- Business owner statistics and exit planning (Project Equity)
- Estate Planning Report 2026 (Trust & Will)
- Family & Finance Study 2025 (Fidelity Investments)
- Insurance Barometer Study 2025 (LIMRA and Life Happens)
- More Americans expect to leave an inheritance, fewer expect to receive one (Northwestern Mutual release) (InsuranceNewsNet)
- Most Americans avoid inheritance talk at the holidays (reporting Trust & Will) (InvestmentNews)
- Only half of American millionaires plan to leave an inheritance (Northwestern Mutual)
- Planning & Progress Study 2025: Leaving a Legacy (Northwestern Mutual)
- Schwab High Net Worth Investor Survey 2024 (Charles Schwab)
- State of Owner Readiness 2025: generational findings (Exit Planning Institute)
- Study of Wealthy Americans 2026 (Bank of America Private Bank)
- The grandparent economy (AARP Research)
- Ultrawealthy heirs and the desire to know how much (reporting the Bank of America study) (Fortune)
- US Family Business Survey 2025 (PwC)
- Will and Estate Planning Survey 2025 (Caring.com)
- World Wealth Report 2025 (press release) (Capgemini)
Research, industry and market data
- $54 trillion will transfer to widows through 2048; more than 95% will go to women (Cerulli Associates)
- A historic year: private giving surpassed $600 billion (reporting Giving USA 2026) (Philanthropy Roundtable)
- A second look at the 30-13-3 statistic (Oregon State University, Austin Family Business Program)
- Aside from paychecks, family money is the most common source of young people's down payments (Redfin)
- Baby Boomers' impact on the housing market (Freddie Mac)
- Billionaire Ambitions Report 2025 (press release) (UBS)
- CareScout 2025 Cost of Care Survey (press release) (Genworth / CareScout)
- Cerulli anticipates $124 trillion in wealth will transfer through 2048 (Cerulli Associates)
- DAF assets soar 30% to $326 billion (reporting the Annual DAF Report 2025) (Chronicle of Philanthropy)
- Giving Report 2026 (Fidelity Charitable)
- Giving USA 2026: charitable giving rose to $617.20 billion in 2025 (Giving USA Foundation and IU Lilly Family School of Philanthropy)
- Global Wealth Report 2025 (press release) (UBS)
- Global Wealth Report 2026 (press release) (UBS)
- The oldest Americans held more real estate wealth than ever before in 2025 (Redfin)
- The oldest Baby Boomers turn 80 in 2026 (Pew Research Center)
- World Wealth Report 2026 (press release) (Capgemini)