
The Most Common Ancestry in Every State 2026: 100 Ancestry Statistics
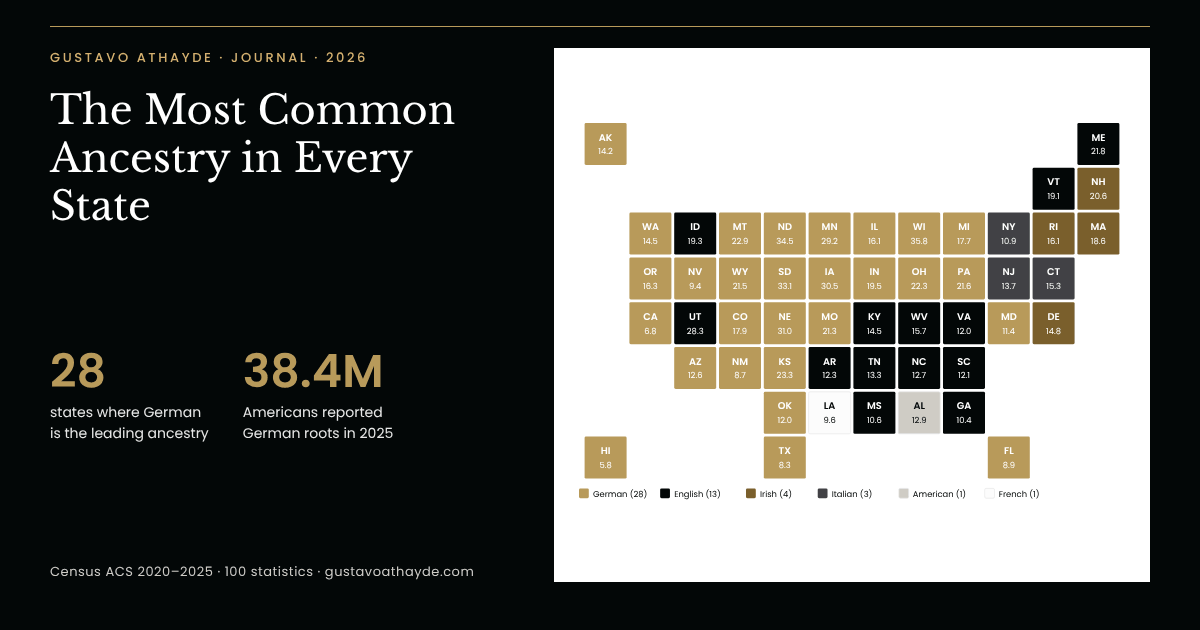
German is still the most common ancestry in America, but it no longer speaks for the whole map. In the Census Bureau’s latest five-year survey, German leads 28 states, home to nearly two in three Americans, while English leads 13, Irish 4, Italian 3, and Alabama and Louisiana answer “American” and French. In 2025, 38.4 million Americans reported German roots, 30.6 million Irish and 29.8 million English.
Below you will find the most common ancestry by state for all 50 states, the runner-up and each state’s signature heritage, a county-level view, and 100 ancestry statistics on immigration, family history and the traditions that keep heritage alive.
At a glance
Key takeaways
- German leads 28 states, English 13, Irish 4, Italian 3; Alabama (“American”) and Louisiana (French) stand alone.
- Wisconsin (35.8% German) has the highest share for any ancestry in any state.
- Utah (28.3%) has the strongest English heritage, nearly three times the U.S. rate.
- New Mexico and D.C. are statistical ties for first place.
- English is the runner-up in 19 states; Norwegian is second in the Dakotas and Minnesota.
- 1,660 of 3,144 counties are led by German, and 15 different ancestries lead at least one county.
- 38.4 million Americans reported German ancestry in 2025; Irish (30.6 million) is statistically ahead of English.
- Counting Hispanic origins, Mexican leads California, Texas, New Mexico, Arizona and Nevada.
The most common ancestry in every state
Every year the Census Bureau asks Americans a simple question, “What is this person’s ancestry or ethnic origin?”, and codes up to two answers per person. We ranked the 50 states by the most common answer in the latest five-year survey, 2020 to 2024, which covers every state and county. German leads the map, but not everywhere: English holds the South and the Mountain West, Irish and Italian hold much of the Northeast, and two states have answers all their own.
The ancestry map at a glance
SHARE THIS CHART
Copy the code below to embed this chart on your site:
Highlights of the ranking
- 1.
28 states name German as their most common ancestry, more than any other heritage; together they are home to 218.8 million people, or 65% of the U.S. population (2020–2024).
— U.S. Census Bureau; Gustavo Athayde analysis
- 2.
13 states name English as their leading ancestry: Arkansas, Georgia, Idaho, Kentucky, Maine, Mississippi, North Carolina, South Carolina, Tennessee, Utah, Vermont, Virginia and West Virginia (2020–2024).
— U.S. Census Bureau; Gustavo Athayde analysis
- 3.
4 states, Delaware, Massachusetts, New Hampshire and Rhode Island, have Irish as their most common ancestry; in the District of Columbia, Irish (8.1%) and German (7.8%) are statistically tied (2020–2024).
— U.S. Census Bureau; Gustavo Athayde analysis
- 4.
3 states, Connecticut, New Jersey and New York, are the only ones where Italian is the leading ancestry; Connecticut has the highest share, 15.3% (2020–2024).
— U.S. Census Bureau; Gustavo Athayde analysis
- 5.
12.9% of Alabamians report their ancestry simply as “American,” making Alabama the only state where that answer comes first, ahead of English (12.1%) (2020–2024).
— U.S. Census Bureau; Gustavo Athayde analysis
- 6.
9.6% of Louisianans report French ancestry, the only state where French leads; Cajun and French Canadian are counted separately (2020–2024).
— U.S. Census Bureau; Gustavo Athayde analysis
- 7.
35.8% of Wisconsin residents report German ancestry, the highest share of any state for any single heritage, followed by North Dakota (34.5%) and South Dakota (33.1%) (2020–2024).
— U.S. Census Bureau; Gustavo Athayde analysis
Records and close races
- 8.
28.3% of Utahns report English ancestry, the highest English share in the nation and nearly three times the U.S. rate of 9.5% (2020–2024).
— U.S. Census Bureau; Gustavo Athayde analysis
- 9.
5.8%: in Hawaii, the leading ancestry on the list, German, is reported by fewer than 6 in 100 residents, the smallest leading share of any state; California follows at 6.8% (2020–2024).
— U.S. Census Bureau; Gustavo Athayde analysis
- 10.
0.15 points separate German (8.7%) and English (8.5%) in New Mexico, the closest race for first place; the two are statistically tied (2020–2024).
— U.S. Census Bureau; Gustavo Athayde analysis
- 11.
25.4 points separate German (35.8%) from Irish (10.4%) in Wisconsin, the widest lead of any state; South Dakota (22.7 points) and Nebraska (19.3) follow (2020–2024).
— U.S. Census Bureau; Gustavo Athayde analysis
- 12.
2.81 million Pennsylvanians report German ancestry, the largest German American population of any state, ahead of California (2.67 million) and Ohio (2.63 million) (2020–2024).
— U.S. Census Bureau; Gustavo Athayde analysis
- 13.
6 ancestries lead at least one state, German, English, Irish, Italian, American and French, while Irish, English and German each rank among the top three in at least 40 states (2020–2024).
— U.S. Census Bureau; Gustavo Athayde analysis
Most common ancestry by state, 1–17
Rank State Most common ancestry Share Second ancestry Share Signature ancestry 1 Wisconsin German 35.8% Irish 10.4% Norwegian 2 North Dakota German 34.5% Norwegian 20.3% Norwegian 3 South Dakota German 33.1% Norwegian 10.4% Norwegian 4 Nebraska German 31.0% Irish 11.7% Czech 5 Iowa German 30.5% Irish 12.8% Norwegian 6 Minnesota German 29.2% Norwegian 12.1% Norwegian 7 Utah English 28.3% German 10.0% Danish 8 Kansas German 23.3% English 12.4% German 9 Montana German 22.9% Irish 13.5% Norwegian 10 Ohio German 22.3% Irish 12.4% German 11 Maine English 21.8% Irish 16.5% French Canadian 12 Pennsylvania German 21.6% Irish 14.8% Italian 13 Wyoming German 21.5% English 15.7% Norwegian 14 Missouri German 21.3% English 11.9% German 15 New Hampshire Irish 20.6% English 18.3% French Canadian 16 Indiana German 19.5% English 11.3% German 17 Idaho English 19.3% German 16.5% Swedish
Most common ancestry by state, 18–34
Rank State Most common ancestry Share Second ancestry Share Signature ancestry 18 Vermont English 19.1% Irish 16.8% French Canadian 19 Massachusetts Irish 18.6% Italian 11.1% Portuguese 20 Colorado German 17.9% English 12.6% Scottish 21 Michigan German 17.7% English 10.5% Dutch 22 Oregon German 16.3% English 14.1% Norwegian 23 Illinois German 16.1% Irish 10.6% Polish 24 Rhode Island Irish 16.1% Italian 14.7% Portuguese 25 West Virginia English 15.7% German 14.7% English 26 Connecticut Italian 15.3% Irish 13.9% French Canadian 27 Delaware Irish 14.8% German 12.4% Italian 28 Kentucky English 14.5% German 12.7% English 29 Washington German 14.5% English 12.1% Norwegian 30 Alaska German 14.2% English 10.0% Norwegian 31 New Jersey Italian 13.7% Irish 12.1% Italian 32 Tennessee English 13.3% American 11.3% English 33 Alabama American 12.9% English 12.1% English 34 North Carolina English 12.7% German 9.4% Scottish
Most common ancestry by state, 35–50
Rank State Most common ancestry Share Second ancestry Share Signature ancestry 35 Arizona German 12.6% English 10.2% English 36 Arkansas English 12.3% German 9.2% English 37 South Carolina English 12.1% German 9.4% Scottish 38 Virginia English 12.0% German 10.1% English 39 Oklahoma German 12.0% English 11.4% Scottish 40 Maryland German 11.4% Irish 9.3% Polish 41 New York Italian 10.9% Irish 10.5% Italian 42 Mississippi English 10.6% American 10.0% English 43 Georgia English 10.4% American 7.6% English 44 Louisiana French 9.6% American 7.4% French 45 Nevada German 9.4% English 8.7% Italian 46 Florida German 8.9% English 8.2% Haitian 47 New Mexico German * 8.7% English 8.5% English 48 Texas German 8.3% English 7.9% English 49 California German 6.8% English 6.3% Italian 50 Hawaii German 5.8% English 5.1% Portuguese — District of Columbia Irish * 8.1% German 7.8% Italian
Rank = share of residents reporting the state’s leading ancestry (heritage concentration), ACS 2020–2024 five-year estimates, Table B04006. Residents may report up to two ancestries; “American” is a self-reported ancestry; unclassified and unreported answers are excluded from the ranking. * = first and second place statistically tied (difference smaller than the combined 90% margin of error). Signature ancestry = the ancestry most overrepresented compared with the U.S. average, among those reported by at least 2% of residents. Source: U.S. Census Bureau; Gustavo Athayde analysis.
Reading the map
What this means
The ancestry map is a record of where families settled and stayed. German farmers filled the Midwest, English and Scots-Irish families carried their names through the Appalachians and across the South, and Irish and Italian families built the cities of the Northeast. A coat of arms often begins with exactly this question of origin; our guide to the custom coat of arms explains how a family’s roots are translated into heraldry.
The runner-up: second most common ancestry by state
The second most common ancestry tells as much about a state as the first. It shows the other half of each state’s founding story: the Norwegians beside the Germans of the Dakotas, the Italians beside the Irish of New England.
Runner-up highlights
- 14.
19 states have English as their second most common ancestry, more than any other runner-up; Irish is second in 13 states and German in 9 states and the District of Columbia (2020–2024).
— U.S. Census Bureau; Gustavo Athayde analysis
- 15.
17 states share the same pairing, German first and English second, the most common combination in the country; German then Irish, and English then German, follow in 8 states each (2020–2024).
— U.S. Census Bureau; Gustavo Athayde analysis
- 16.
20.3% of North Dakotans report Norwegian ancestry, the highest runner-up share in the nation; Norwegian is also second in Minnesota (12.1%) and South Dakota (10.4%) (2020–2024).
— U.S. Census Bureau; Gustavo Athayde analysis
- 17.
4 Southern states, Georgia, Louisiana, Mississippi and Tennessee, have “American” as their second most common ancestry (2020–2024).
— U.S. Census Bureau; Gustavo Athayde analysis
- 18.
11.1% of Massachusetts residents report Italian ancestry, second only to Irish (18.6%); Rhode Island has the same Irish-Italian pairing (2020–2024).
— U.S. Census Bureau; Gustavo Athayde analysis
- 19.
6 states have a statistical tie for second place: Alaska, Arkansas, Florida, Louisiana, Missouri and Montana; in Missouri, English (11.9%) and Irish (11.8%) are almost level (2020–2024).
— U.S. Census Bureau; Gustavo Athayde analysis
Each state’s signature ancestry
The most common ancestry in a state is often the most common one nationally. A signature ancestry is different: it is the heritage most overrepresented in a state compared with the country as a whole, among those reported by at least 2% of residents. It is the answer that makes each state distinct.
- 20.
17.3 times: North Dakotans are 17.3 times as likely as Americans overall to report Norwegian ancestry, statistically level with Rhode Island’s Portuguese heritage as the strongest signature of any state (2020–2024).
— U.S. Census Bureau; Gustavo Athayde analysis
- 21.
17.3 times the national rate: Rhode Island’s Portuguese heritage, reported by 7.0% of residents, matches North Dakota’s Norwegian heritage as the most concentrated in the country (2020–2024).
— U.S. Census Bureau; Gustavo Athayde analysis
- 22.
14.9 times the national rate: French Canadian is the signature ancestry of New Hampshire (7.2%), and also of Vermont, Maine and Connecticut (2020–2024).
— U.S. Census Bureau; Gustavo Athayde analysis
- 23.
11.7 times the national rate: 4.0% of Utahns report Danish ancestry, the state’s signature heritage (2020–2024).
— U.S. Census Bureau; Gustavo Athayde analysis
- 24.
10 states have Norwegian as their signature ancestry, the one most overrepresented compared with the nation, from Minnesota and the Dakotas to Washington, Oregon and Alaska (2020–2024).
— U.S. Census Bureau; Gustavo Athayde analysis
Ten of the strongest signature ancestries
State Signature ancestry Share of residents Times the U.S. rate Rhode Island Portuguese 7.0% 17.3× North Dakota Norwegian 20.3% 17.3× New Hampshire French Canadian 7.2% 14.9× Vermont French Canadian 6.9% 14.2× Maine French Canadian 6.2% 12.7× Utah Danish 4.0% 11.7× Minnesota Norwegian 12.1% 10.3× Nebraska Czech 3.6% 9.7× Massachusetts Portuguese 3.6% 8.9× South Dakota Norwegian 10.4% 8.9×
Times the U.S. rate = share of state residents reporting the ancestry divided by the national share, ACS 2020–2024. Source: U.S. Census Bureau, Table B04006; Gustavo Athayde analysis.
More signature ancestries
- 25.
9.7 times the national rate: Czech is Nebraska’s signature ancestry, reported by 3.6% of residents (2020–2024).
— U.S. Census Bureau; Gustavo Athayde analysis
- 26.
3 states, Massachusetts, Rhode Island and Hawaii, have Portuguese as their signature ancestry, a heritage rooted in 19th-century migration to New England and Hawaii (2020–2024).
— U.S. Census Bureau; Gustavo Athayde analysis
- 27.
6 states and the District of Columbia have Italian as their signature ancestry: New York, New Jersey, Pennsylvania, Delaware, Nevada and California (2020–2024).
— U.S. Census Bureau; Gustavo Athayde analysis
- 28.
6.9 times the national rate: Haitian is Florida’s signature ancestry, reported by 2.3% of residents (2020–2024).
— U.S. Census Bureau; Gustavo Athayde analysis
- 29.
4.1 times the national rate: Dutch is Michigan’s signature ancestry (3.8%); Polish is the signature of Illinois and Maryland (2020–2024).
— U.S. Census Bureau; Gustavo Athayde analysis
What this means
A signature ancestry is often where a family’s visual heritage is most alive: a Norwegian rosemaling pattern, a Portuguese azulejo, a French Canadian fleur-de-lis. Families who want a crest that honors that specific line, rather than a generic national symbol, can read our guide to the luxury family crest.
Ancestry by county: the map at close range
At the county level, the picture becomes sharper. The same five-year survey covers all 3,144 counties and county equivalents, from Los Angeles County to Loving County, Texas.
- 30.
1,660 of the nation’s 3,144 counties and county equivalents, or 52.8%, have German as their most common ancestry (2020–2024).
— U.S. Census Bureau; Gustavo Athayde analysis
- 31.
752 counties are led by English ancestry, 446 by “American” and 175 by Irish (2020–2024).
— U.S. Census Bureau; Gustavo Athayde analysis
- 32.
15 different ancestries lead at least one U.S. county, including Norwegian (22 counties), Finnish (5), Portuguese (3), Dutch (2) and Czech (1) (2020–2024).
— U.S. Census Bureau; Gustavo Athayde analysis
- 33.
178.6 million Americans, more than half the population, live in a county where German is the most commonly reported ancestry (2020–2024).
— U.S. Census Bureau; Gustavo Athayde analysis
- 34.
1,096 counties, about one in three, have a lead too narrow to call: their top two ancestries are statistically tied (2020–2024).
— U.S. Census Bureau; Gustavo Athayde analysis
County records
- 35.
62.8% of residents of Oliver County, North Dakota, report German ancestry, the highest share for any ancestry in any county of 1,000 or more people (2020–2024).
— U.S. Census Bureau; Gustavo Athayde analysis
- 36.
27 counties, all in the Midwest, have a German majority, with more than half of residents reporting German ancestry; Washington County, Wisconsin (137,879 residents) is the largest (2020–2024).
— U.S. Census Bureau; Gustavo Athayde analysis
- 37.
40.8% of residents of Sioux County, Iowa, report Dutch ancestry, the highest Dutch share in the country; Ottawa County, Michigan (26.0%) is the largest Dutch-led county (2020–2024).
— U.S. Census Bureau; Gustavo Athayde analysis
- 38.
43.2% of Nelson County, North Dakota, report Norwegian ancestry, the highest Norwegian share of the 22 Norwegian-led counties (2020–2024).
— U.S. Census Bureau; Gustavo Athayde analysis
- 39.
22.9% of Staten Island (Richmond County, New York) residents report Italian ancestry, the highest Italian share of the 33 Italian-led counties (2020–2024).
— U.S. Census Bureau; Gustavo Athayde analysis
- 40.
27.6% of residents of Plymouth County, Massachusetts, report Irish ancestry, the highest share among the 175 Irish-led counties (2020–2024).
— U.S. Census Bureau; Gustavo Athayde analysis
- 41.
65 of 66 South Dakota counties name German as their leading ancestry; in Minnehaha County, home of Sioux Falls, 31.5% report German and 12.1% Norwegian roots (2020–2024).
— U.S. Census Bureau; Gustavo Athayde analysis
Counties led by each ancestry
Ancestry Counties led Most populous county led Highest share German 1,660 Los Angeles County, California Oliver County, North Dakota (62.8%) English 752 Harris County, Texas Rich County, Utah (39.8%) American 446 Miami-Dade County, Florida Buchanan County, Virginia (59.7%) Irish 175 Middlesex County, Massachusetts Plymouth County, Massachusetts (27.6%) Italian 33 Kings County (Brooklyn), New York Richmond County (Staten Island), New York (22.9%) French 28 East Baton Rouge Parish, Louisiana Avoyelles Parish, Louisiana (20.5%) Norwegian 22 Polk County, Minnesota Nelson County, North Dakota (43.2%) Finnish 5 Houghton County, Michigan Houghton County, Michigan (25.3%) Portuguese 3 Bristol County, Massachusetts Bristol County, Massachusetts (22.5%) Dutch 2 Ottawa County, Michigan Sioux County, Iowa (40.8%)
Most commonly reported ancestry in each of 3,144 counties and county equivalents, ACS 2020–2024. Highest share among counties of 1,000 or more residents. Also leading at least one county: African (9), European (6), Haitian, Jamaican and Czech (1 each). Source: U.S. Census Bureau, Table B04006; Gustavo Athayde analysis.
What this means
In much of rural America, a county’s leading ancestry is still a family matter: the same surnames on the mailboxes, the church rolls and the cemetery stones for five or six generations. That continuity is what a family monogram or seal is meant to carry forward; our guide to heraldic crests shows how lineage becomes design.
America’s largest ancestries and how they have changed
The single-year 2025 survey, released this fall, gives the newest national count. German remains the largest ancestry, but fewer Americans report it than in 2010, while English and Scottish have grown. Counts for 2025 run slightly lower across most groups because the Census Bureau changed how it codes written-in answers in June 2025, so year-to-year comparisons below use 2024.
Ancestry in 2025
- 42.
38.4 million Americans reported German ancestry in 2025, 11.2% of the population, the largest ancestry group in the United States.
— U.S. Census Bureau; Gustavo Athayde analysis
- 43.
30.6 million Americans reported Irish ancestry in 2025, statistically ahead of English (29.8 million) for second place.
— U.S. Census Bureau; Gustavo Athayde analysis
- 44.
19.9 million people described their ancestry simply as “American” in 2025, the fourth-largest answer, ahead of Italian (15.5 million).
— U.S. Census Bureau; Gustavo Athayde analysis
- 45.
7.7 million Americans reported Polish ancestry in 2025, the sixth-largest group, followed by Scottish (6.2 million) and French (5.8 million).
— U.S. Census Bureau; Gustavo Athayde analysis
- 46.
23 of the 41 states with single-year 2025 ancestry estimates name German as their leading ancestry, English leads 11 and Irish and Italian 3 each, the same pattern as the five-year data (2025).
— U.S. Census Bureau; Gustavo Athayde analysis
- 47.
83.8 million to 92.2 million: the count of unclassified or unreported ancestries rose between 2024 and 2025, after the Census Bureau changed how it codes written-in ancestries in June 2025.
— U.S. Census Bureau; U.S. Census Bureau; U.S. Census Bureau; Gustavo Athayde analysis
Change since 2010
- 48.
-16.0%: the number of Americans reporting German ancestry fell from 47.9 million in 2010 to 40.2 million in 2024, though German remains the largest ancestry.
— U.S. Census Bureau; U.S. Census Bureau; Gustavo Athayde analysis
- 49.
+19.6%: English ancestry was reported by 31.0 million Americans in 2024, up from 25.9 million in 2010, one of only two of the 13 large European ancestries we track to grow.
— U.S. Census Bureau; U.S. Census Bureau; Gustavo Athayde analysis
- 50.
+20.5%: Scottish ancestry grew fastest among the larger European groups, from 5.5 million in 2010 to 6.6 million in 2024.
— U.S. Census Bureau; U.S. Census Bureau; Gustavo Athayde analysis
- 51.
-6.6%: Irish ancestry held up better than most, easing from 34.7 million in 2010 to 32.4 million in 2024; Italian declined -5.6%, to 16.3 million.
— U.S. Census Bureau; U.S. Census Bureau; Gustavo Athayde analysis
- 52.
-35.2%: Dutch ancestry recorded the steepest decline among the larger European ancestries, from 4.6 million in 2010 to 3.0 million in 2024; French fell -30.0%.
— U.S. Census Bureau; U.S. Census Bureau; Gustavo Athayde analysis
Counting every heritage: Hispanic and Asian origins
The ancestry table covers European, Middle Eastern, African and Caribbean origins, while Hispanic and Asian origins are measured by separate Census questions. Placing them side by side changes the map in the Southwest and Hawaii. A person can be counted in more than one of these groups, so this is a comparison of heritage groups, not a single ranking.
- 53.
37.9 million Americans are of Mexican origin, the second-largest heritage in the country when Hispanic origins are counted alongside ancestry, behind German (41.8 million) and ahead of English (31.7 million) (2020–2024).
— U.S. Census Bureau; U.S. Census Bureau; Gustavo Athayde analysis
- 54.
5 states, California, Texas, New Mexico, Arizona and Nevada, would have Mexican as their most common heritage if Hispanic origins were counted alongside ancestry; New Mexico has the highest share, 32.4% (2020–2024).
— U.S. Census Bureau; U.S. Census Bureau; Gustavo Athayde analysis
- 55.
25.7% of Hawaii residents are of Filipino descent and 22.0% of Japanese descent, the state’s two largest heritage groups when Asian origins are counted (2020–2024).
— U.S. Census Bureau; U.S. Census Bureau; Gustavo Athayde analysis
- 56.
3 more states, Illinois, Colorado and Utah, would have Mexican as their second most common heritage (2020–2024).
— U.S. Census Bureau; U.S. Census Bureau; Gustavo Athayde analysis
States where the combined view changes the leader
State Leading ancestry (ancestry question) Leading heritage (all questions) New Mexico German, 8.7% Mexican, 32.4% California German, 6.8% Mexican, 32.3% Texas German, 8.3% Mexican, 32.1% Arizona German, 12.6% Mexican, 26.9% Nevada German, 9.4% Mexican, 21.4% Hawaii German, 5.8% Filipino, 25.7%
Shares of total population, ACS 2020–2024: ancestry (Table B04006), Hispanic origin (B03001) and Asian groups alone or in any combination (B02018). Source: U.S. Census Bureau; Gustavo Athayde analysis.
- 57.
397 counties, home to 91.9 million people, would have Mexican as their leading heritage on a combined count; German would still lead the most counties, 1,429 (2020–2024).
— U.S. Census Bureau; U.S. Census Bureau; U.S. Census Bureau; Gustavo Athayde analysis
- 58.
35.3% of Los Angeles County residents are of Mexican origin, while the county’s leading European ancestry, German, is reported by 4.3% (2020–2024).
— U.S. Census Bureau; U.S. Census Bureau; Gustavo Athayde analysis
- 59.
68 million Americans, 20% of the population, were Hispanic as of July 1, 2024, the nation’s largest heritage group outside the European ancestries.
How the Census measures ancestry, and what the 2020 Census found
Ancestry is self-reported, and the answer depends on how the question is asked. The 2020 Census added a write-in line for detailed origins under the race question, and its results differ from the ancestry survey.
- 60.
46.6 million people identified as English, alone or in combination, in the 2020 Census, ahead of German (45 million) and Irish (38.6 million); the census asks a different question from the ancestry survey, which is why the order differs.
- 61.
35 states had English alone as their largest detailed White group in the 2020 Census; German alone led in 10 states and Italian alone in 4.
- 62.
2,050 counties, about two-thirds of the nation, had English as their largest detailed White group in the 2020 Census; German led in more than 1,000 and Irish in 80.
- 63.
1980 was the first census to ask Americans about their ancestry; since the 2000 census, the question has been carried by the American Community Survey.
Method, Irish America and family names
- 64.
107 ancestry groups are estimated in the Census Bureau’s ancestry table as of 2025; when someone reports more than two ancestries, only the first two are tabulated.
- 65.
116,641 U.S. residents were born in Ireland in 2024, against 32.4 million who claim Irish ancestry, a measure of how many generations separate most Irish Americans from the old country.
- 66.
436,577 residents of Cook County, Illinois (8.4%), claimed Irish ancestry in 2024, the largest Irish American population of any county.
- 67.
8 of the 15 most common last names in the 2020 Census were already in the top 15 at the first census in 1790, among 7.8 million different surnames recorded in 2020.
Two centuries of immigration behind the map
Today’s map was drawn by two centuries of arrivals. Federal immigration records go back to 1820 and show when each wave came.
- 68.
88.5 million people obtained lawful permanent residence in the United States from 1820 through 2022.
— U.S. Department of Homeland Security; Gustavo Athayde analysis
- 69.
7.36 million immigrants came from Germany between 1820 and 2022, more than from any other European country; the United Kingdom (5.59 million), Italy (5.51 million) and Ireland (4.82 million) follow.
— U.S. Department of Homeland Security; Gustavo Athayde analysis
- 70.
1,445,181 German immigrants arrived in the 1880s, the peak decade of German immigration, much of it to the farms and towns of the Midwest, where German heritage still leads today.
- 71.
1,029,486 Irish immigrants arrived in the 1850s, the peak decade of Irish immigration after the Great Famine.
- 72.
Nearly half of all immigrants to the United States in the 1840s were Irish, and more than one-third from 1820 to 1860 (Library of Congress; historical).
The great arrival
- 73.
1,930,475 Italian immigrants arrived between 1900 and 1909 and another 1,229,916 in 1910–1919; by 1920 more than 4 million Italians had come to the United States.
- 74.
8,202,388 immigrants arrived in 1900–1909, a decade record that stood until the 1990s.
- 75.
586,441 immigrants from Norway and Sweden arrived in the 1880s, the peak decade of Norwegian and Swedish immigration, much of it bound for the Upper Midwest.
- 76.
12 million immigrant passengers were processed at Ellis Island between 1892 and 1954, and the National Park Service estimates that about 40% of Americans can trace their ancestry through it.
Family history, roots travel and citizenship by descent
Interest in ancestry has moved from the census form to the kitchen table. Millions of Americans now test their DNA, build family trees and travel to the towns their great-grandparents left.
- 77.
21% of Americans have taken a DNA test, rising to 28% among adults 65 and older (YouGov, January 2025).
— YouGov
- 78.
31% of Americans would like to know a great deal about their family’s ancestry or heritage, while 9% say they already do (YouGov, 2025).
— YouGov
- 79.
59% of Americans who have taken or would take a DNA test say the main reason is to learn about their ancestry and heritage; 54% want to trace their family lineage (YouGov, 2025).
— YouGov
- 80.
70% of Americans say knowing their family’s history is important, and 32% say it makes them feel proud (Ipsos, 2021).
— Ipsos
- 81.
29 million people have joined Ancestry’s DNA network, and the company holds more than 70 billion historical records (company figures, 2025).
— Ancestry
Heirlooms and traditions
- 82.
1.8 billion people are now in the FamilySearch Family Tree, which grew by more than 163 million people in 2025.
- 83.
58% of Americans have received a sentimental item passed down from a family member, and 59% plan to leave something behind to carry on the tradition (Talker Research, 2025).
- 84.
47% of Americans say at least most of their winter holiday traditions were passed down from earlier generations, and 84% say handing traditions down benefits the young (Harris Poll for the Archbridge Institute, 2022).
- 85.
70% of Hispanic immigrants say their heritage is extremely or very important to how they see themselves, compared with 57% of the second generation and 47% of the third or higher (Pew Research Center, 2025 survey).
Roots travel and citizenship by descent
- 86.
18,910 applicants from the United States sought Irish citizenship through the Foreign Births Register in 2025, a record and 63% more than in 2024 (The Irish Times).
- 87.
816%: U.S. applications to Ireland’s Foreign Births Register rose roughly ninefold in a decade, from 2,064 in 2015 to 18,910 in 2025.
- 88.
1.33 million overnight visits to Ireland were made by U.S. residents in 2025, 7.2% more than in 2024.
— Central Statistics Office (Ireland); Gustavo Athayde analysis
- 89.
80 million: nearly that many people of Italian descent live around the world, and roots tourism brought about €5 billion to Italy in 2024, up 34.4% (Italian Ministry of Foreign Affairs).
- 90.
2 generations: under Italy’s 2025 citizenship reform, descendants born abroad are citizens from birth only if a parent or grandparent was born in Italy.
- 91.
40 million people worldwide can claim Scottish ancestry, and more than 25% of visitors to Scotland from the U.S., Canada and Australia cite ancestry as a major reason for their trip (VisitScotland, 2023 survey).
What this means
Families who research their roots often want something to show for it: a crest drawn from the old country, a monogram that joins two family lines or a signet ring engraved for the next generation. Our guide to signet design explains how a family symbol is made to be worn and passed down.
Heritage celebrations and traditions
Heritage lives on in parades, festivals and lineage societies across the country, many of them older than the states that host them.
- 92.
$7.7 billion was the record amount Americans expected to spend on St. Patrick’s Day in 2026, up from $7 billion in 2025 (National Retail Federation forecast).
- 93.
60% of Americans planned to celebrate St. Patrick’s Day in 2026, spending a record $47.45 per person on average (NRF survey of 7,901 adults).
- 94.
1762: New York City’s St. Patrick’s Day Parade, first held fourteen years before the Declaration of Independence, now draws about 150,000 marchers and 2 million spectators, according to organizers.
- 95.
808,300 people attended Oktoberfest Zinzinnati in Cincinnati in 2025, a record for what organizers call America’s largest Oktoberfest.
- 96.
13 families from Krefeld who landed in Philadelphia in 1683 are honored on German-American Day, October 6, first designated by Congress in 1987 and proclaimed each year since.
Festivals, communities and lineage societies
- 97.
976,000 visitors attended Holland, Michigan’s Tulip Time Festival in 2025, a record and about 30% more than in 2024, according to organizers.
- 98.
1978: Norsk Høstfest in Minot, North Dakota, founded that year, has grown into North America’s largest Scandinavian festival.
- 99.
404,575 Amish lived in the United States in 2025, keeping a Pennsylvania German heritage alive in 32 states, led by Pennsylvania (95,410), Ohio (86,325) and Indiana (67,310).
— Young Center for Anabaptist and Pietist Studies, Elizabethtown College
- 100.
190,000 women belong to the Daughters of the American Revolution, a lineage society that has admitted more than one million members since 1890.
Methodology
Our ranking uses Table B04006 (People Reporting Ancestry) of the American Community Survey 2020–2024 five-year estimates, the latest release that covers all 50 states, the District of Columbia and 3,144 counties and county equivalents. Each person may report up to two ancestries, so the groups overlap and their totals exceed the population. We excluded the summary lines for Arab, Sub-Saharan African and West Indian groups, “other groups” and “unclassified or not reported”; “American” is kept because respondents choose it themselves.
Ties are tested with the Census Bureau’s 90% margins of error: two ancestries are statistically tied when their difference is smaller than the square root of the sum of their squared margins. For each state, the signature ancestry is the group with the highest ratio of state share to national share among those reported by at least 2% of residents, excluding “American” and “European.” National figures for 2025 come from the 2025 one-year survey, published for 41 states and the District of Columbia; change since 2010 compares the 2010 and 2024 one-year estimates, because the Census Bureau changed how it codes written-in ancestries in June 2025.
The combined heritage view places ancestry next to Hispanic origin (Table B03001) and Asian groups alone or in any combination (Table B02018); a person may be counted in more than one. The 2020 Census detailed counts come from a different question and are reported separately. Comparisons are descriptive, not causal.
About the author

Gustavo Athayde — Founder & Creative Director, GUSTAVO ATHAYDE
Gustavo Athayde is the founder and creative director of GUSTAVO ATHAYDE, a bespoke monogram atelier based in Sioux Falls, South Dakota. A graphic designer by training, he creates monograms, personal and family crests, heraldic emblems, signet designs and wax seals for individuals, families, couples and brands across the United States. Every commission is refined line by line into a symbol meant to be kept, used and passed down.
Follow the atelier on Instagram · Request a private consultation
Frequently asked questions
- What is the most common ancestry in the United States?
- German. In 2025, 38.4 million Americans reported German ancestry, ahead of Irish (30.6 million) and English (29.8 million), according to the American Community Survey.
- Which ancestry is most common in each state?
- German leads 28 states, English 13, Irish 4 (Delaware, Massachusetts, New Hampshire and Rhode Island), Italian 3 (Connecticut, New Jersey and New York), “American” leads Alabama and French leads Louisiana.
- Which state has the most German ancestry?
- Wisconsin has the highest share, 35.8% of residents. Pennsylvania has the largest number, about 2.81 million people.
- Why does the 2020 Census show English as the largest group?
- The 2020 Census counted detailed origins through a write-in line under the race question, while the ancestry survey asks a separate question. Different questions produce different rankings, so the two are not combined.
- What does “American” ancestry mean?
- It is the answer some respondents give when they consider their roots simply American, often after many generations in the country. It is most common in the South, led by Alabama (12.9%).
- Where does Norwegian ancestry stand out?
- North Dakota, where 20.3% of residents report Norwegian roots, 17.3 times the national rate. Minnesota has the largest number, 692,350 people.
Cite this page
Source: Gustavo Athayde, "The Most Common Ancestry in Every State 2026", https://gustavoathayde.com/most-common-ancestry-by-state/Feel free to use these statistics and charts — we just ask for a link back to this page.
Sources
- 2020 Census names data (press release, April 2026) (U.S. Census Bureau)
- ACS User Note 2026-07: ancestry coding in 2025 data (U.S. Census Bureau)
- Ancestry estimates for 2010, Table B04006 (ACS 1-year) (U.S. Census Bureau)
- Asian alone or in any combination by selected groups, Table B02018, ACS 2020–2024 (U.S. Census Bureau)
- B04006 five-year estimates, 2020–2024: people reporting ancestry (ACS) (U.S. Census Bureau)
- Census Academy one-pager: Ancestry (U.S. Census Bureau)
- Council of Ministers approves changes to the citizenship law (ius sanguinis) (Italian Ministry of Foreign Affairs)
- Detailed look at the White population, 2020 Census DHC-A (U.S. Census Bureau)
- Fact sheet: Ellis Island (National Park Service)
- Hispanic Heritage Month 2025 (Facts for Features) (U.S. Census Bureau)
- Hispanic or Latino origin by specific origin, Table B03001, ACS 2020–2024 (U.S. Census Bureau)
- Inbound Tourism December 2025 (Central Statistics Office (Ireland))
- Irish-American Heritage Month: March 2026 (Facts for Features) (U.S. Census Bureau)
- Irish-Catholic immigration to America (Library of Congress)
- Italian immigration: the great arrival (Library of Congress)
- Last Name Data From the 2020 Census (C2020BR-14) (U.S. Census Bureau)
- People reporting ancestry in 2024, Table B04006 (ACS 1-year) (U.S. Census Bureau)
- Roots tourism (Turismo delle Radici) (Italian Ministry of Foreign Affairs)
- Table B04006 for 2025: people reporting ancestry (ACS 1-year) (U.S. Census Bureau)
- Yearbook of Immigration Statistics 2022, Table 2 (U.S. Department of Homeland Security)
Research and surveys
- Americans yearn for tradition this holiday season (Harris Poll) (Archbridge Institute)
- Consumers leaning into St. Patrick's Day in 2026 as holiday spending climbs (National Retail Federation)
- Latino immigrants and U.S.-born Latinos differ on how much their identity shapes their lives (Pew Research Center)
- Legacy and love take priority for aging Americans (Talker Research)
- Majority of Americans think knowing their ancestry is important (2021) (Ipsos)
- St. Patrick's Day data and trends (National Retail Federation)
- What Americans think about home DNA tests (poll, January 2025) (YouGov)
Heritage organizations, companies and news
- About Norsk Høstfest (Norsk Høstfest)
- About the parade (NYC St. Patrick's Day Parade)
- Almost 19,000 applications received from US citizens for Irish passports last year (The Irish Times)
- Amish population, 2025 (Young Center for Anabaptist and Pietist Studies, Elizabethtown College)
- Ancestry 2025 Impact Report (press release) (Ancestry)
- FamilySearch 2025 genealogy highlights (FamilySearch)
- German-American Day (German American Heritage Museum of the USA)
- Market report: ancestral tourism (citing VisitScotland), February 2026 (Business Gateway)
- Oktoberfest Zinzinnati (Oktoberfest Zinzinnati)
- The National Society (Daughters of the American Revolution)
- Tulip Time Festival 2025 shatters attendance records (Michigan West Coast Chamber of Commerce)
- U.S. applications to Ireland's Foreign Births Register (IrishCentral)