
The Best and Worst States for an Outdoor Wedding (Rain Odds by Month)
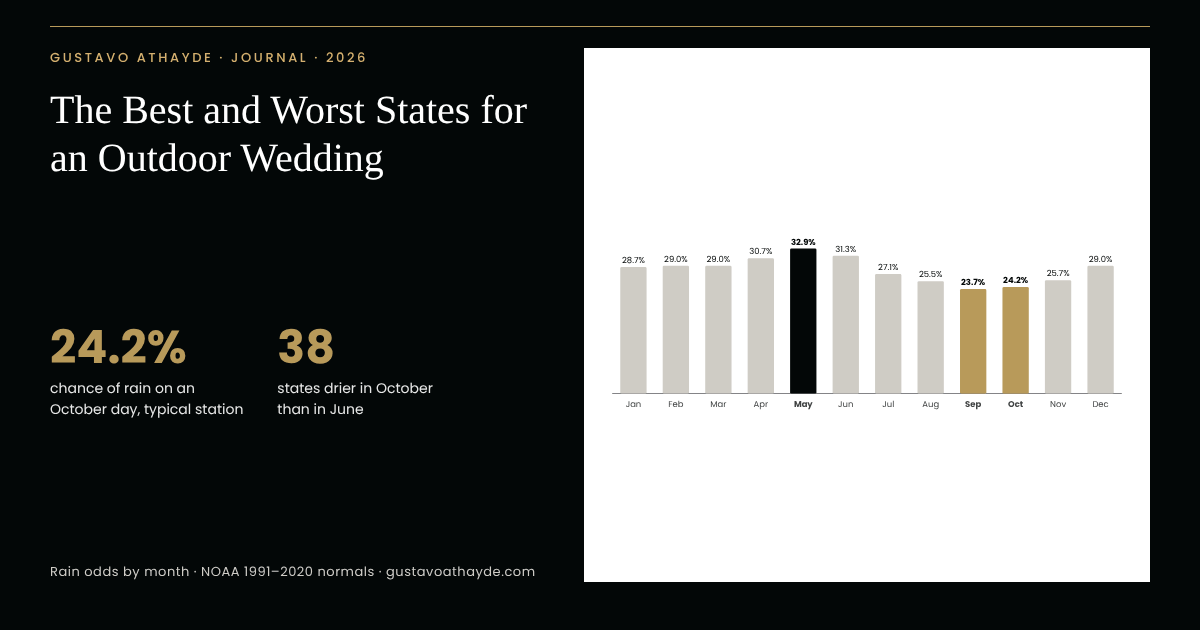
Is June the safest choice for an outdoor wedding? The data say otherwise. We analyzed outdoor wedding weather across all 50 states using NOAA’s official 1991–2020 Climate Normals from 4,654 long-record weather stations. At the typical station, a June day carries a 31.3% chance of measurable rain, against 24.2% for an October day, and 38 states are drier in October than in June.
Below you will find our Outdoor Wedding Rain Index for every state, rain odds for 30 popular wedding cities, and 100 statistics on seasons, storms, venues and where Americans marry.
At a glance
Key takeaways
- September (23.7%) and October (24.2%) are the driest months nationally; May (32.9%) is the wettest.
- California, Arizona, Nevada, New Mexico and Texas lead our Outdoor Wedding Rain Index.
- A June day is 29% more likely to bring rain than an October day at the typical U.S. station.
- Florida’s June odds reach 47.3%, falling to 26.1% by October, the largest drop of any state.
- The Pacific Northwest is the exception: Washington’s driest month is July (13.9%), and October climbs to 46.0%.
- Las Vegas (1.3%), Phoenix and Los Angeles (1.7%) have the lowest June odds among 30 wedding cities.
- 57% of couples held their ceremony outdoors in 2023, and 71% did so in the West.
- June and October tie as the most popular wedding months at 16% each.
The Outdoor Wedding Rain Index: every state ranked
Our Outdoor Wedding Rain Index averages, for each state, the chance of measurable rain on a given day in the four busiest outdoor wedding months: May, June, September and October. A lower score means a better chance of a dry ceremony.
SHARE THIS CHART
Copy the code below to embed this chart on your site:
Highlights of the ranking
- 1.
6.9% is California’s average chance of rain on a given day across May, June, September and October, the lowest of any state and the top score in our Outdoor Wedding Rain Index (1991–2020 normals).
— NOAA National Centers for Environmental Information; Gustavo Athayde analysis
- 2.
Arizona (9.8%), Nevada (12.8%), New Mexico (15.6%) and Texas (20.0%) follow California as the five states with the lowest peak-season rain odds (1991–2020 normals).
— NOAA National Centers for Environmental Information; Gustavo Athayde analysis
- 3.
Oklahoma, Kansas, Colorado, Arkansas and Mississippi complete the top 10, each with a peak-season rain chance between 22.6% and 25.5% on a given day (1991–2020 normals).
— NOAA National Centers for Environmental Information; Gustavo Athayde analysis
- 4.
Vermont (42.7%), New York (41.2%) and Pennsylvania (39.2%) post the highest peak-season rain odds in the continental U.S.; their frequent showers are usually light and short (1991–2020 normals).
— NOAA National Centers for Environmental Information; Gustavo Athayde analysis
- 5.
44.8% is Hawaii’s peak-season index, the highest in the nation, because many of its long-record gauges sit on lush windward slopes; Honolulu’s airport, on the sheltered leeward side, shows just 21.0% in June (1991–2020 normals).
— NOAA National Centers for Environmental Information; Gustavo Athayde analysis
Full ranking, states 1–17
Rank State Index May June Sept. Oct. Driest month, Apr.–Oct. Stations 1 California 6.9% 11.1% 3.7% 3.3% 9.7% August (1.6%) 226 2 Arizona 9.8% 6.1% 5.2% 16.7% 11.0% June (5.2%) 96 3 Nevada 12.8% 20.0% 10.2% 9.3% 11.6% August (7.1%) 82 4 New Mexico 15.6% 13.5% 13.5% 20.2% 15.0% April (11.3%) 106 5 Texas 20.0% 21.9% 21.3% 19.0% 17.7% July (15.8%) 327 6 Utah 20.2% 24.8% 13.3% 20.0% 22.6% June (13.3%) 166 7 Oklahoma 22.6% 27.4% 24.5% 19.3% 19.4% July (18.4%) 82 8 Kansas 24.6% 31.0% 28.0% 20.0% 19.4% October (19.4%) 193 9 Colorado 24.9% 30.0% 21.5% 25.7% 22.4% June (21.5%) 206 10 Arkansas 25.5% 31.6% 25.3% 21.0% 24.2% September (21.0%) 107 11 Mississippi 25.5% 28.4% 31.0% 21.7% 21.0% October (21.0%) 67 12 Idaho 25.8% 34.2% 25.2% 18.0% 25.8% July (13.2%) 126 13 Alabama 26.0% 26.8% 33.7% 22.7% 20.6% October (20.6%) 71 14 Georgia 26.3% 24.2% 35.3% 24.7% 21.0% October (21.0%) 65 15 Nebraska 26.7% 34.2% 32.0% 20.7% 20.0% October (20.0%) 133 16 Louisiana 27.3% 24.5% 36.0% 26.7% 21.9% October (21.9%) 77 17 South Carolina 27.5% 27.1% 34.7% 26.3% 21.9% October (21.9%) 49
Full ranking, states 18–34
Rank State Index May June Sept. Oct. Driest month, Apr.–Oct. Stations 18 Oregon 27.8% 36.5% 24.3% 16.0% 34.2% July (8.1%) 161 19 South Dakota 27.9% 33.5% 35.5% 21.0% 21.6% September (21.0%) 88 20 North Dakota 28.2% 31.6% 37.2% 22.7% 21.5% October (21.5%) 54 21 Wyoming 28.7% 36.8% 28.0% 23.0% 27.1% July (18.7%) 147 22 Missouri 30.2% 38.1% 32.0% 24.3% 26.5% September (24.3%) 100 23 Montana 30.2% 36.8% 37.0% 22.0% 25.2% August (19.4%) 213 24 North Carolina 30.8% 32.6% 35.7% 30.0% 24.8% October (24.8%) 107 25 Delaware 30.9% 33.9% 33.7% 29.3% 26.8% October (26.8%) 3 26 Kentucky 31.0% 37.6% 34.7% 25.2% 26.5% September (25.2%) 52 27 Illinois 31.8% 39.4% 34.3% 25.0% 28.4% September (25.0%) 120 28 Tennessee 32.0% 37.4% 37.0% 26.7% 26.8% September (26.7%) 82 29 Iowa 32.8% 40.3% 37.7% 26.7% 26.5% October (26.5%) 115 30 New Jersey 33.3% 38.1% 35.7% 28.7% 30.6% September (28.7%) 19 31 Virginia 33.3% 39.4% 36.7% 30.0% 27.1% October (27.1%) 82 32 Maryland 33.3% 37.7% 36.3% 30.3% 29.0% October (29.0%) 17 33 Indiana 33.5% 40.6% 37.3% 26.3% 29.7% September (26.3%) 80 34 Washington 34.6% 36.8% 29.7% 25.8% 46.0% July (13.9%) 136
Full ranking, states 35–50
Rank State Index May June Sept. Oct. Driest month, Apr.–Oct. Stations 35 Minnesota 34.7% 38.1% 40.3% 30.5% 30.0% April (29.8%) 92 36 Florida 35.6% 23.9% 47.3% 45.0% 26.1% April (20.7%) 73 37 Connecticut 35.8% 41.0% 37.7% 30.7% 33.9% September (30.7%) 11 38 Wisconsin 35.9% 39.7% 38.7% 32.7% 32.6% August (31.6%) 111 39 Ohio 36.1% 43.2% 39.7% 29.3% 32.1% September (29.3%) 82 40 Massachusetts 36.1% 40.6% 37.7% 30.7% 35.5% August (30.3%) 33 41 Alaska 37.0% 26.5% 33.7% 47.3% 40.3% April (22.3%) 71 42 Rhode Island 37.0% 41.3% 37.7% 31.8% 37.3% September (31.8%) 4 43 Michigan 37.6% 39.2% 35.3% 34.3% 41.8% July (31.9%) 76 44 West Virginia 38.2% 45.5% 42.7% 31.7% 33.1% September (31.7%) 52 45 Maine 38.7% 41.3% 42.3% 33.0% 38.1% September (33.0%) 39 46 New Hampshire 38.7% 41.6% 42.7% 32.7% 37.7% September (32.7%) 21 47 Pennsylvania 39.2% 44.2% 41.7% 34.0% 36.8% September (34.0%) 101 48 New York 41.2% 42.3% 41.3% 36.7% 44.5% August (35.5%) 73 49 Vermont 42.7% 43.9% 47.7% 36.3% 42.9% September (36.3%) 13 50 Hawaii 44.8% 40.6% 48.0% 45.0% 45.5% May (40.6%) 47
Chance of at least 0.01 inch of precipitation on a given day, median of each state’s long-record NOAA stations, 1991–2020. Index = average of May, June, September and October. Delaware (3 stations) and Rhode Island (4) rest on small samples. Source: NOAA NCEI; Gustavo Athayde analysis.
Reading the ranking
What this means
A state’s place in the ranking describes its climate, not the quality of its celebrations: Vermont and New York host some of the country’s most admired autumn weddings. In wetter states, the timing of the season and a well-planned covered space matter more than the date alone. Couples planning a monogram for a garden or tented ceremony can find ideas in our guide to the luxury wedding monogram.
Outdoor wedding weather statistics by month
Across the country, the odds of a dry wedding day are not spread evenly through the year. Late spring is the wettest stretch, and early autumn is the driest.
Month by month
- 6.
23.7% is the chance of measurable rain (0.01 inch or more) on a given September day at the typical U.S. weather station, making September the driest month of the year in the 1991–2020 climate normals.
— NOAA National Centers for Environmental Information; Gustavo Athayde analysis
- 7.
32.9% is the chance of measurable rain on a given May day at the typical U.S. station, the highest of any month in the 1991–2020 normals; the typical station records 10.2 rainy days in May.
— NOAA National Centers for Environmental Information; Gustavo Athayde analysis
- 8.
29% more likely: a June day carries a 31.3% chance of measurable rain at the typical U.S. station, against 24.2% for an October day (1991–2020 normals).
— NOAA National Centers for Environmental Information; Gustavo Athayde analysis
June against October
- 9.
9.4 vs. 7.5: the typical U.S. station logs 9.4 days with measurable rain in June and 7.5 in October, even though October has one more day (1991–2020 normals).
— NOAA National Centers for Environmental Information; Gustavo Athayde analysis
- 10.
16.1% is the chance that an October day brings a soaking 0.10 inch or more at the typical U.S. station, the lowest of any month; June stands at 22.3% (1991–2020 normals).
— NOAA National Centers for Environmental Information; Gustavo Athayde analysis
- 11.
38 of 50 states have lower odds of rain on an October day than on a June day, based on the median weather station in each state (1991–2020 normals).
— NOAA National Centers for Environmental Information; Gustavo Athayde analysis
- 12.
29 states reach their driest month of the April–October outdoor season in September (16 states) or October (13 states) (1991–2020 normals).
— NOAA National Centers for Environmental Information; Gustavo Athayde analysis
What 4,654 weather stations show
- 13.
782 of 4,654 long-record U.S. weather stations show a 40% or higher chance of rain on a given June day; in October the count falls to 450 (1991–2020 normals).
— NOAA National Centers for Environmental Information; Gustavo Athayde analysis
- 14.
380 stations — about 8% of the 4,654 analyzed — give a June day less than a 10% chance of rain, nearly all of them in the Southwest and California (1991–2020 normals).
— NOAA National Centers for Environmental Information; Gustavo Athayde analysis
- 15.
More than 15,000 U.S. stations reporting precipitation feed NOAA’s official 1991–2020 U.S. Climate Normals, first released in May 2021.
- 16.
0.01 inch is the threshold behind NOAA’s count of days with measurable precipitation, the variable used for every rain-odds figure in this article (1991–2020 normals).
June weddings: rain odds by state
June shares the title of America’s most popular wedding month with October, but its weather varies more from region to region. The West is at its driest; the Gulf Coast and Florida enter their thunderstorm season.
- 17.
3.7% is the chance of measurable rain on a given June day in California, the lowest of any state; Arizona follows at 5.2% and Nevada at 10.2% (1991–2020 normals).
— NOAA National Centers for Environmental Information; Gustavo Athayde analysis
- 18.
13.3% in Utah and 13.5% in New Mexico round out the five states where a June day is least likely to bring rain (1991–2020 normals).
— NOAA National Centers for Environmental Information; Gustavo Athayde analysis
- 19.
47.3% is Florida’s chance of measurable rain on a given June day, more than double its April figure of 20.7%, as the summer thunderstorm season begins (1991–2020 normals).
— NOAA National Centers for Environmental Information; Gustavo Athayde analysis
- 20.
More than 90 days a year bring thunderstorm activity to central and southern Florida (1993–2018 average).
- 21.
About 70% of South Florida’s yearly rainfall arrives during its rainy season, which runs from May 15 to October 15 (NWS Miami, 2021).
- 22.
May 25 to October 10 is the rainy season for most of West Central Florida, according to the National Weather Service in Tampa Bay (accessed 2026).
June Saturdays in 2027
- 23.
9 states carry a 40% or higher chance of rain on a June day: Florida, Hawaii, Maine, Minnesota, New Hampshire, New York, Pennsylvania, Vermont and West Virginia (1991–2020 normals).
— NOAA National Centers for Environmental Information; Gustavo Athayde analysis
- 24.
1.9 of the 4 Saturdays in June 2027 would see measurable rain in a typical Florida year, compared with 0.1 in California (Gustavo Athayde analysis: 4 Saturdays × the state’s June odds, 1991–2020 normals).
— NOAA National Centers for Environmental Information; Gustavo Athayde analysis
- 25.
13.9% is Washington’s chance of rain on a July day and 8.1% Oregon’s, making high summer — not autumn — the Pacific Northwest’s dependable outdoor window (1991–2020 normals).
— NOAA National Centers for Environmental Information; Gustavo Athayde analysis
What this means
For a June celebration east of the Rockies, an earlier ceremony hour and a covered reception space are prudent choices, since afternoon storms are common. Couples comparing dates for next year can consult our analysis of the most popular wedding dates of 2027.
September and October: the drier half of wedding season
For most of the country, early autumn brings the steadiest weather of the year. The Pacific Northwest is the notable exception, as its storm season returns in October.
- 26.
9.7% is California’s chance of rain on a given October day, the only state under 10%; Arizona (11.0%), Nevada (11.6%), New Mexico (15.0%) and Texas (17.7%) follow (1991–2020 normals).
— NOAA National Centers for Environmental Information; Gustavo Athayde analysis
- 27.
20.6% to 21.9%: October is the driest month of the outdoor season in Alabama, Georgia, Mississippi, Louisiana and South Carolina, with a chance of rain on a given day in that range (1991–2020 normals).
— NOAA National Centers for Environmental Information; Gustavo Athayde analysis
- 28.
21.2 points: Florida’s rain odds fall from 47.3% on a June day to 26.1% on an October day, the largest June-to-October drop of any state; North Dakota (−15.7 points) and Georgia (−14.3) follow (1991–2020 normals).
— NOAA National Centers for Environmental Information; Gustavo Athayde analysis
- 29.
46.0% is Washington’s chance of rain on an October day, up 16.3 points from June, the largest increase of any state as the Pacific storm season returns (1991–2020 normals).
— NOAA National Centers for Environmental Information; Gustavo Athayde analysis
The driest month in each state
- 30.
6 states carry a 40% or higher chance of rain on an October day: Alaska, Hawaii, Michigan, New York, Vermont and Washington (1991–2020 normals).
— NOAA National Centers for Environmental Information; Gustavo Athayde analysis
- 31.
1.2 of the 5 Saturdays in October 2027 would see measurable rain at the typical U.S. weather station, versus 1.3 of June 2027’s four Saturdays (Gustavo Athayde analysis of 1991–2020 normals).
— NOAA National Centers for Environmental Information; Gustavo Athayde analysis
- 32.
June 1 to November 30 is the Atlantic hurricane season, and its climatological peak falls on September 10, with most activity between mid-August and mid-October (NOAA National Hurricane Center, 2026).
- 33.
14 named storms, 7 hurricanes and 3 major hurricanes form in an average Atlantic season, based on 1991–2020 records.
Rain odds in 30 popular wedding cities
State medians blend mountains, coasts and plains. For a specific celebration, the nearest long-record airport station gives a closer reading, so we checked 30 cities that draw many weddings.
City highlights
- 34.
1.3% is the chance of rain on a given June day at Las Vegas’s main airport station, the lowest of the 30 wedding cities we checked; Phoenix and Los Angeles follow at 1.7% (1991–2020 normals).
— NOAA National Centers for Environmental Information; Gustavo Athayde analysis
- 35.
58.7% is Miami’s chance of measurable rain on a June day, rising to 60.3% in September; by October it eases to 44.5% (1991–2020 normals).
— NOAA National Centers for Environmental Information; Gustavo Athayde analysis
- 36.
54.0% vs. 27.1%: an October day in Orlando is half as likely to bring rain as a June day (1991–2020 normals).
— NOAA National Centers for Environmental Information; Gustavo Athayde analysis
- 37.
40% or more in June, about 22% in October: Charleston (40.3% vs. 23.5%), Savannah (41.0% vs. 21.9%) and New Orleans (42.3% vs. 22.9%) show the strongest autumn advantage among Southern wedding cities (1991–2020 normals).
— NOAA National Centers for Environmental Information; Gustavo Athayde analysis
- 38.
46.1% is Seattle’s chance of rain on an October day, against 30.7% in June; Portland, Oregon, shows 43.5% in October and 30.7% in June (1991–2020 normals).
— NOAA National Centers for Environmental Information; Gustavo Athayde analysis
City rain odds, driest 15
City May June Sept. Oct. Las Vegas, NV 3.5% 1.3% 6.0% 5.5% Los Angeles, CA 5.5% 1.7% 1.7% 6.5% Phoenix, AZ 3.2% 1.7% 8.3% 7.1% San Diego, CA 7.1% 2.3% 3.0% 7.7% Santa Barbara, CA 6.5% 3.0% 4.7% 7.1% San Francisco, CA 10.6% 4.0% 3.0% 10.0% Salt Lake City, UT 28.7% 16.0% 17.3% 21.0% Austin, TX 25.2% 21.7% 22.0% 21.3% Denver, CO 33.5% 27.0% 20.0% 17.1% Honolulu, HI 19.4% 21.0% 24.0% 24.8% Dallas–Fort Worth, TX 29.4% 24.0% 17.0% 22.9% Houston, TX 27.7% 33.3% 28.0% 24.8% Atlanta, GA 30.3% 37.0% 24.3% 21.9% Washington, D.C., D.C. 37.4% 35.3% 29.0% 26.8% Nashville, TN 37.4% 35.7% 26.0% 27.1%
City rain odds, remaining 15
City May June Sept. Oct. Savannah, GA 23.5% 41.0% 33.0% 21.9% Charleston, SC 26.1% 40.3% 34.0% 23.5% Sioux Falls, SD 39.0% 39.3% 27.0% 25.5% New Orleans, LA 25.2% 42.3% 32.7% 22.9% Tampa, FL 20.0% 44.3% 42.7% 23.2% New York City, NY 37.1% 37.3% 29.3% 30.6% Asheville, NC 37.1% 44.7% 30.7% 25.2% Minneapolis–St. Paul, MN 40.0% 39.3% 31.0% 30.6% Boston, MA 38.1% 36.3% 30.0% 33.9% Chicago, IL 40.3% 37.0% 28.3% 33.9% Portland, OR 42.6% 30.7% 22.3% 43.5% Key West, FL 24.2% 37.3% 52.7% 39.0% Seattle, WA 36.5% 30.7% 27.7% 46.1% Orlando, FL 27.1% 54.0% 47.3% 27.1% Miami, FL 34.8% 58.7% 60.3% 44.5%
Chance of at least 0.01 inch of precipitation on a given day, main airport or city station, 1991–2020 normals; sorted by the average of June and October. Washington, D.C., uses Reagan National Airport. Source: NOAA NCEI; Gustavo Athayde analysis.
More city findings
- 39.
37.3% vs. 30.6%: New York’s Central Park station gives a June day a 37.3% chance of rain and an October day 30.6% (1991–2020 normals).
— NOAA National Centers for Environmental Information; Gustavo Athayde analysis
- 40.
17.1% is Denver’s chance of rain on an October day, down from 27.0% in June, when afternoon mountain storms are common (1991–2020 normals).
— NOAA National Centers for Environmental Information; Gustavo Athayde analysis
- 41.
44.7% is Asheville’s chance of rain on a June day, the highest of the 30 cities outside Florida, falling to 25.2% in October (1991–2020 normals).
— NOAA National Centers for Environmental Information; Gustavo Athayde analysis
- 42.
39.3% vs. 25.5%: in Sioux Falls, South Dakota, home of our atelier, a June day is about one and a half times as likely to bring rain as an October day (1991–2020 normals).
— NOAA National Centers for Environmental Information; Gustavo Athayde analysis
- 43.
21.0% is the chance of rain on a June day at Honolulu’s airport, less than half the 48.0% median of Hawaii’s long-record gauges (1991–2020 normals).
— NOAA National Centers for Environmental Information; Gustavo Athayde analysis
Regional weather patterns every couple should know
Each region has its own rhythm: the Southwest’s monsoon, California’s dry summer, Hawaii’s windward showers and the Plains’ growing-season rains. Knowing that rhythm is the first step to choosing a date.
- 44.
10 inches or less of annual precipitation falls across much of the Southwest, against more than 50 inches in Florida, under the 1991–2020 normals.
- 45.
10.2 inches is Nevada’s long-term statewide average annual precipitation (1895–2024), which makes it the nation’s driest state.
- 46.
More than half of California’s annual precipitation falls from December through February (statewide averages 1895–2024), which leaves its summers reliably dry.
- 47.
5.3 of 12.2 inches: monsoon rain supplies a large share of Arizona’s statewide average annual precipitation (1895–2024), and more than half in the southernmost part of the state.
- 48.
June 15 to September 30 has been Arizona’s official monsoon season since the National Weather Service set those dates in 2008.
- 49.
96°F is the typical June high at Arizona’s median weather station, the hottest of any state, while October averages 81°F; Texas (91°F) and Florida, Louisiana and New Mexico (90°F) follow in June (1991–2020 normals).
— NOAA National Centers for Environmental Information; Gustavo Athayde analysis
The Pacific, Hawaii and the Plains
- 50.
May through October is Hawaii’s dry season; the wet season runs from November through April (NOAA State Climate Summaries, 2025).
- 51.
More than 300 inches of rain can fall in a year on Hawaii’s windward mountain slopes, while leeward coasts receive under 20 inches (1991–2020).
- 52.
Over 100 inches of precipitation falls in a year at some locations west of Washington’s Coast Range and Cascades, while parts of Central Washington receive less than 10 (NOAA State Climate Summaries, 2025).
- 53.
19.3 inches is South Dakota’s statewide average annual precipitation (1895–2024), most of it between April and September.
- 54.
More than 60 days a year bring thunderstorm activity across most of Louisiana, and over 90 in the southeast (1993–2018 average); the statewide average is 57.2 inches of precipitation (1895–2024).
- 55.
62°F is Alaska’s typical June high, the coolest of any state; Maine follows at 73°F (1991–2020 normals).
— NOAA National Centers for Environmental Information; Gustavo Athayde analysis
Lightning, storms and summer heat
Rain is the most common weather concern, but summer thunderstorms and heat deserve equal planning for an outdoor ceremony.
- 56.
About 20 people are killed by lightning in the United States each year, and July averaged 6 of those 20 deaths over 2016–2025, more than any other month.
- 57.
More than 70% of U.S. lightning deaths occurred in June, July or August in 2006–2019, a period with 418 deaths in all.
- 58.
62% of U.S. lightning deaths from 2006 to 2019 happened during leisure activities, and Fridays, Saturdays and Sundays saw slightly more deaths than other days of the week.
- 59.
Two out of three U.S. lightning deaths occur between noon and 6 p.m., the hours of most afternoon ceremonies (CDC, 2006–2025 data).
- 60.
Five states — Alaska, Delaware, Hawaii, New Hampshire and Washington — recorded no lightning deaths from 2006 through 2025, a period with 517 deaths nationwide.
Strikes, odds and heat
- 61.
About 25 million lightning strikes hit the United States each year, and “bolts from the blue” can strike 10 to 15 miles from a thunderstorm (National Weather Service, 2026).
- 62.
1 in 15,300 is the National Weather Service estimate of an American’s odds of being struck by lightning over an 80-year lifetime (based on 2009–2018 averages).
- 63.
279 heat deaths a year is the U.S. 10-year average for 2016–2025, more than any other weather hazard and about 2.4 times the flood average of 118.
What this means
The National Weather Service advice is simple: when thunder roars, go indoors. A venue with an indoor fallback, shade for guests and water on hand protects the day as well as the photographs.
When American couples marry
American couples still favor the classic seasons. The data on when they marry, and what they spend, set the context for the weather odds above.
- 64.
$34,000 was the average cost of a U.S. wedding in 2025, with 117 guests, according to The Knot’s 2026 Real Weddings Study of 10,474 couples married that year.
- 65.
- 66.
- 67.
14% of couples now marry in May and 13% in September, while December draws just 1% (The Knot Real Weddings Study, page updated 2026).
— The Knot
- 68.
Five Saturdays — June 6, June 20, September 19, September 26 and October 10 — were The Knot’s most popular wedding dates of 2026.
— The Knot
Months, costs and destinations
- 69.
13.42% of Zola couples planning 2023 weddings chose September, edging out June (13.35%) and May (13.33%) among 4,249 couples surveyed.
— Zola
- 70.
$35,400 was the average cost of a July–September wedding the highest of any quarter, while October–December weddings averaged $33,200, according to The Knot’s proprietary data (page updated 2026).
— The Knot
- 71.
7,481 marriage licenses were issued in Clark County, Nevada, in October 2025, more than in any other month; May followed with 7,243, while the hot months of June and July drew 5,443 and 5,308.
— Clark County Clerk, Nevada (weddings.vegas); Gustavo Athayde analysis
- 72.
What this means
The most requested dates book first at venues, calligraphers and engravers alike. Couples marrying in October should allow extra lead time for invitations and a custom wax seal. For budgets by state, see wedding cost by state.
Outdoor ceremonies, venues and rain plans
Outdoor ceremonies have become the norm rather than the exception, which makes a thoughtful weather plan part of every wedding.
- 73.
57% of U.S. couples married in 2023 held their ceremony outdoors; in the West the share reached 71% (The Knot Real Weddings Venue Report).
- 74.
70% of couples in the West put the outdoors first in 2024, with a strong preference for open-air venues, and 20% there described their weddings as “outdoorsy,” against 13% nationwide (The Knot 2025 Real Weddings Study, 16,956 couples).
- 75.
18% of U.S. couples held their 2023 reception at a farm, barn or ranch, rising to 26% in the Southwest (The Knot Real Weddings Venue Report).
- 76.
Roughly 1 in 10 couples in the South and Southeast held their 2023 ceremony at a beach or beach house (The Knot Real Weddings Venue Report).
- 77.
Nearly 40% of a couple’s wedding budget goes to the venue on average, the largest single expense (The Knot Real Weddings Venue Report, 2023 weddings).
- 78.
No. 1: outdoor garden venues are the top choice of couples planning 2026 weddings for the second year in a row, followed by farms, barns and ranches (Zola First Look Report 2026, 11,500+ couples).
— Zola
- 79.
31.83% of Zola couples planning 2024 weddings ranked outdoor space among their top three venue priorities, while 24.88% ranked covered or indoor space for weather (close to 7,000 couples).
— Zola
Weather concerns, tents and insurance
- 80.
49.51% of couples planning 2023 weddings said they were concerned that weather could affect their wedding (Zola, 4,249 couples).
— Zola
- 81.
8% of couples married in 2022 moved their ceremony or reception from indoors to outdoors, down from 17% in 2021 (The Knot 2023 Real Weddings Study).
— The Knot
- 82.
$2,000 to $10,000 is the typical cost of a wedding tent before labor and delivery, with 15 to 30 square feet planned per guest (The Knot, 2023).
— The Knot
- 83.
10% of the wedding insurance claims Travelers paid in 2025 were caused by extreme weather, down from 22% in 2024; vendor problems led with 55%.
- 84.
- 85.
“Sposa bagnata, sposa fortunata” — a wet bride is a lucky bride — is a belief “fairly universal throughout Italy,” according to the Dartmouth Folklore Archive (2016).
Where Americans marry: destination states
Weddings are counted where they take place, so destination states such as Nevada and Hawaii stand far above their population. Utah leads when marriages are measured by where couples live.
- 86.
2,128,446 marriages were recorded in the United States in 2024, a provisional rate of 6.3 per 1,000 residents, up from 6.1 in 2023.
- 87.
24.6 marriages per 1,000 residents made Nevada the leading state for weddings in 2023, about four times the national rate of 6.1; rates are counted where the wedding takes place.
— CDC National Center for Health Statistics; CDC National Center for Health Statistics
- 88.
12.5 marriages per 1,000 residents placed Hawaii second in 2023, followed by Utah (11.2) and Montana (9.2).
- 89.
215,199 marriages made California the state with the most weddings in 2023, ahead of Texas (178,055) and Florida (158,790).
- 90.
3.8% of all U.S. marriages in 2023 took place in Nevada, a total of 78,489 weddings.
— CDC National Center for Health Statistics; Gustavo Athayde analysis
- 91.
14% more marriages were recorded in Utah in 2023 than in 2022 (38,250 vs. 33,456), the state with the third-highest marriage rate.
— CDC National Center for Health Statistics; Gustavo Athayde analysis
Marriage by where couples live
- 92.
51.7 marriages per 1,000 unmarried women made Utah the leading state for the fifth year in a row in 2024, ahead of Idaho (44.3) and Colorado (43.0) (2024 American Community Survey).
— National Center for Family & Marriage Research, Bowling Green State University
- 93.
13.2% of never-married young adults in the Provo, Utah, area married in a single year, compared with 2.7% in Newark, New Jersey (Institute for Family Studies map, ACS 2020–2024).
Las Vegas
- 94.
6% of first-time Las Vegas visitors in 2024 came to attend a wedding or to marry, compared with 2% of repeat visitors (LVCVA survey of 5,418 visitors).
- 95.
15.9% of the 70,598 Las Vegas–area marriage licenses issued in 2025 went to couples with a California mailing address, the largest single source of Clark County weddings.
— Clark County Clerk, Nevada (weddings.vegas); Gustavo Athayde analysis
Hawaii, the national parks and public opinion
- 96.
62.4% of the 17,925 marriages performed in Hawaii in 2023 joined two people who both lived outside the state.
— Hawaii Department of Business, Economic Development and Tourism; Gustavo Athayde analysis
- 97.
66,375 visitors flew to Hawaii in 2024 to get married, and 336,950 came on their honeymoon.
— Hawaii Department of Business, Economic Development and Tourism
- 98.
60 ceremonies a month is the cap at Rocky Mountain National Park from May to October, and dates in May–June and August–October 2026 were fully booked.
- 99.
60 ceremonies a year is the limit at each of Grand Teton National Park’s large ceremony sites, all of which were listed as full for 2026.
- 100.
39% of Americans say it is very important for a couple with a child together to be married, up 10 points from 2020 (Gallup, 1,001 adults, May 2026).
— Gallup
What this means
Whether the ceremony takes place in a Nevada chapel, on a Hawaiian beach or in a family garden, the date and the place become part of a couple’s story. Many choose to record both in a monogram or crest; couples planning a smaller celebration can also read our elopement and micro-wedding statistics.
Methodology
Rain odds are the average number of days per month with at least 0.01 inch of precipitation in NOAA’s 1991–2020 U.S. Climate Normals, divided by the number of days in the month. We used the monthly station archive (15,616 station files) and kept the 4,654 stations in the 50 states whose precipitation-day normals meet NOAA’s “standard” completeness flag in all 12 months.
Each state’s figure is the median across its stations, so it describes a typical location rather than a population-weighted average; states with many mountain gauges, such as Hawaii, read wetter than their resort coasts. City figures use each city’s main airport or downtown station. The Outdoor Wedding Rain Index is the simple average of May, June, September and October.
Climate normals are 30-year averages, not forecasts, and weather does not depend on the day of the week, so a Saturday carries the same odds as any other day. Expected rainy Saturdays multiply the number of Saturdays in a 2027 month by the state’s daily odds. Marriage rates from the CDC count weddings where they occur; comparisons are descriptive.
About the author

Gustavo Athayde — Founder & Creative Director, GUSTAVO ATHAYDE
Gustavo Athayde is the founder and creative director of GUSTAVO ATHAYDE, a bespoke monogram atelier based in Sioux Falls, South Dakota. A graphic designer by training, he creates monograms, personal and family crests, heraldic emblems, signet designs and wax seals for individuals, families, couples and brands across the United States. Every commission is refined line by line into a symbol meant to be kept, used and passed down.
Follow the atelier on Instagram · Request a private consultation
Frequently asked questions
- What is the best month for an outdoor wedding?
- Nationally, September (23.7%) and October (24.2%) give the lowest chance of rain on a given day, according to NOAA’s 1991–2020 normals. In the Pacific Northwest, July is the driest month, and in Arizona and Utah it is June.
- Which state has the lowest chance of rain on a wedding day?
- California does: its typical station shows a 6.9% chance of rain on a given day across May, June, September and October, and just 3.7% in June. Arizona and Nevada follow.
- Is June or October better for an outdoor wedding?
- October is drier in 38 of 50 states, including Florida, Georgia, the Carolinas and the Plains. June is the better choice in 12 states, mostly in the West.
- What does “chance of rain” mean in this analysis?
- It is the share of days with at least 0.01 inch of precipitation over 1991–2020 at the typical station in each state. It is a long-term average, not a forecast for a specific date.
- Does wedding insurance cover rain?
- Usually not for ordinary showers: Markel says an average summer thunderstorm would not be covered, while extreme weather such as a hurricane can be. Read each policy’s weather terms before booking.
Cite this page
Source: Gustavo Athayde, "The Best and Worst States for an Outdoor Wedding (Rain Odds by Month)", https://gustavoathayde.com/outdoor-wedding-rain-odds/Feel free to use these statistics and charts — we just ask for a link back to this page.
Sources
- Analysis of Lightning Fatalities 2006–2019 (National Weather Service)
- Arizona: State Climate Summaries 2025 (NOAA NCEI / NCICS)
- California: State Climate Summaries 2025 (NOAA NCEI / NCICS)
- Florida: State Climate Summaries 2025 (NOAA NCEI / NCICS)
- Hawaii: State Climate Summaries 2025 (NOAA NCEI / NCICS)
- How Dangerous is Lightning? (National Weather Service)
- Lightning Fatalities (National Weather Service)
- Lightning Strike Victim Data (Centers for Disease Control and Prevention)
- Louisiana: State Climate Summaries 2025 (NOAA NCEI / NCICS)
- Monsoon season (Arizona Department of Water Resources)
- Monthly Normals 1991–2020 documentation (NOAA National Centers for Environmental Information)
- Myths and facts about lightning (National Weather Service)
- Nevada: State Climate Summaries 2025 (NOAA NCEI / NCICS)
- New maps of annual average temperature and precipitation (NOAA Climate.gov)
- Rainy Season (National Weather Service Tampa Bay)
- South Dakota: State Climate Summaries 2025 (NOAA NCEI / NCICS)
- South Florida Rainy Season Outlook (National Weather Service Miami)
- Tropical Cyclone Climatology (NOAA National Hurricane Center)
- U.S. Climate Normals (NOAA National Centers for Environmental Information)
- U.S. Climate Normals 1991–2020, monthly station files (NOAA National Centers for Environmental Information)
- Washington: State Climate Summaries 2025 (NOAA NCEI / NCICS)
- Weather Related Fatality and Injury Statistics, 1940–2025 (National Weather Service)
- When thunder roars, go indoors: lightning safety (National Weather Service)
Marriage data
- 2024 Annual Visitor Research Report (Hawaii Department of Business, Economic Development and Tourism)
- 2025 marriage license file (Clark County Clerk, Nevada (weddings.vegas))
- Americans more likely to say parents should marry (Gallup)
- Geographic Variation in the U.S. Marriage Rate, 2024 (National Center for Family & Marriage Research, Bowling Green State University)
- Las Vegas Visitor Profile Study 2024 (Las Vegas Convention and Visitors Authority)
- Marriage rates by state, 1990, 1995 and 2000–2023 (CDC National Center for Health Statistics)
- National marriage and divorce rate trends, 2000–2024 (CDC National Center for Health Statistics)
- New interactive map reveals where young Americans are actually getting married (Institute for Family Studies)
- Number of marriages by state, 2000–2023 (CDC National Center for Health Statistics)
- State of Hawaii Data Book 2024, Table 2.40: Marriages by residence (Hawaii Department of Business, Economic Development and Tourism)
- Wedding commitments — Grand Teton National Park (National Park Service)
- Weddings — Rocky Mountain National Park (National Park Service)
Wedding industry data
- Best season for a wedding (The Knot)
- Destination weddings: the domestination trend (The Knot)
- Event insurance for weddings (Travelers)
- Everything you need to know about wedding tents (The Knot)
- Fall is the most popular wedding season (The Knot)
- First Look Report 2023: deep data dive (Zola)
- First Look Report 2026 (Zola)
- How much does the average wedding cost? (The Knot)
- Is there an off-season for weddings? (The Knot)
- Press release: The Knot Worldwide unveils 2026 Real Weddings Study (The Knot Worldwide)
- Real Weddings Venue Report (WeddingPro / The Knot)
- Sposa bagnata, sposa fortunata (Dartmouth Folklore Archive)
- Travelers announces most frequent wedding claims of 2024 (Travelers (Business Wire))
- Travelers identifies most common wedding insurance claims of 2025 (Travelers (Business Wire))
- Vendor report, 2025 Real Weddings Study (WeddingPro / The Knot)
- Wedding insurance (Markel)
- Wedding trends 2024: First Look Report data deep dive (Zola)
- Weddings in 2022: Real Weddings Study (The Knot)
- Weddings in 2024: Real Weddings Study (The Knot)