
Proposal Statistics 2026: When, Where and How Americans Pop the Question
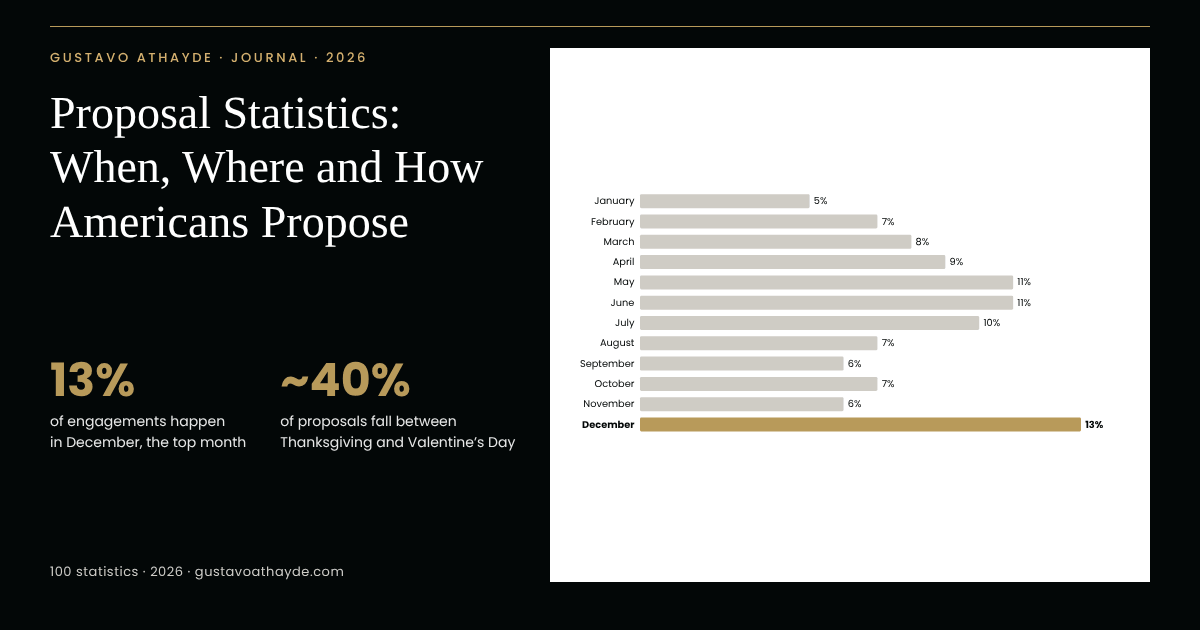
America still proposes in December. It is the most popular month to get engaged, Christmas Day is the most popular day, and about 40% of proposals fall between Thanksgiving and Valentine’s Day. Adjusted for its 31 days, December produces 53% more proposals per day than an average day of the year.
Yet these proposal statistics also hold a surprise: April through July, taken together, account for more engagements than the holiday months. Below are 100 statistics on when, where and how Americans pop the question, from the family blessing that about seven in ten still ask for to the years couples spend together before the wedding.
At a glance
Key takeaways
- December is the most popular month to get engaged, and Christmas Day the most popular day.
- Adjusted for length, December yields 153 proposals per 100 on an average day; January yields 59.
- April through July together account for 41% of engagements, more than November through February (31%).
- December has brought 18% to 20% of annual sales at U.S. jewelry stores.
- Jewelry is the largest Valentine’s Day category, with $7 billion in planned 2026 spending.
- 72% of proposals take place outdoors, 53% are private, and more than one in five happen on vacation.
- 89% propose with a ring in hand and 85% kneel; 81% of proposals are a surprise.
- About 70% of proposers ask the parents’ permission or blessing.
- Couples date about three years before engaging and stay engaged about 14 months.
- 68% of never-married young men and 69% of never-married young adults want to marry someday.
When Americans propose: proposal statistics by month
December is the month of engagements by every measure. Yet the calendar is fuller than the holiday story suggests: late spring and early summer, taken together, account for more proposals than the winter holidays.
SHARE THIS CHART
Copy the code below to embed this chart on your site:
Month by month
- 1.
December is the most popular month to get engaged, with Christmas Day the top day of the year, according to a survey of 10,474 couples married in 2025.
- 2.
13% of couples marrying in 2025 got engaged in December, the highest share of any month.
- 3.
May and June followed, at 11% each, and July at 10%; January was the quietest month for proposals, at 5% (couples marrying in 2025).
- 4.
Christmas is the most popular date to get engaged, followed by Christmas Eve, December 23 and New Year’s Eve, among couples marrying in 2025.
- 5.
Adjusted for the length of each month, December produces 153 proposals for every 100 on an average day of the year, the highest rate on the calendar; January produces 59 (couples marrying in 2025).
— Gustavo Athayde analysis of Zola First Look Report 2025 data
- 6.
Late spring and summer still add up to more: April through July account for 41% of engagements, against 31% for November through February (couples marrying in 2025).
— Gustavo Athayde analysis of Zola First Look Report 2025 data
The 2026 Engagement Calendar Index
The index divides each month’s share of proposals by its number of days, so that a 31-day month does not look busier simply for being longer. A score of 100 is an average day of the year.
Month Share of proposals Days Proposals per day (avg. day = 100) Share of weddings (2007) January 5% 31 59 6.0% February 7% 28 91 6.5% March 8% 31 94 7.1% April 9% 30 110 7.4% May 11% 31 130 8.6% June 11% 30 134 10.1% July 10% 31 118 11.1% August 7% 31 82 10.4% September 6% 30 73 9.1% October 7% 31 82 9.1% November 6% 30 73 7.9% December 13% 31 153 6.7%
Sources: proposals, Zola First Look Report 2025 (couples marrying in 2025; engagements mostly in 2023–2024); weddings, NCHS, National Vital Statistics Reports 57-11 (2007, the last year of national monthly counts). Index: Gustavo Athayde analysis.
History and the wider world
- 7.
In 2022, December was the top engagement month, with 15% of couples, and Christmas Eve and Christmas Day were the top dates.
- 8.
Among couples married in 2017, 16% got engaged in December, while other months ranged from 7% to 9% (historical data, about 18,000 couples).
- 9.
The December peak is not only American: engagement season peaks in December across the U.S., the U.K., Brazil and Mexico, according to The Knot Worldwide’s 2025 Global Wedding Report of 33,174 couples married in 2024 across eight countries.
- 10.
Proposals and weddings keep different calendars: December is the busiest month to get engaged but, in the last federal count by month, one of the quietest to marry, with 6.7% of 2007 weddings, against 11.1% in July (historical data).
— Gustavo Athayde analysis of Zola First Look Report 2025, NCHS, National Vital Statistics Reports 57-11 data
Two calendars
What this means for couples. A December proposal usually leads to a wedding the following year, which leaves time to design what will last beyond the day. Many couples begin with a couple’s monogram, the first mark of a shared name. Our guide to the most popular wedding dates picks up from there.
Engagement season: Thanksgiving to New Year’s
Roughly two in five proposals fall between Thanksgiving and Valentine’s Day, and America’s jewelers plan their year around it. December alone has brought close to a fifth of annual sales at jewelry stores.
The season in numbers
- 11.
About 40% of proposals take place between Thanksgiving and Valentine’s Day (couples married in 2025).
- 12.
December has accounted for 18.2% to 20.2% of annual sales at U.S. jewelry stores in every year from 2010 to 2019, an average of 19.1% (latest data published by the Census Bureau for this store category).
— Gustavo Athayde analysis of U.S. Census Bureau, Monthly Retail Trade Survey data
- 13.
In 2019, U.S. jewelry stores sold $5.57 billion in December, out of $29.56 billion for the year.
- 14.
December sales at jewelry stores were 2.55 times the average of the other eleven months in 2019, and November and December together made up 27.4% of the year.
— Gustavo Athayde analysis of U.S. Census Bureau, Monthly Retail Trade Survey data
America’s jewelers and the holidays
- 15.
Signet Jewelers, parent of Kay, Zales and Jared, says its fourth quarter, which includes the November–December holiday season, has historically accounted for approximately 35–40% of annual sales (fiscal 2026 annual report).
- 16.
Bridal jewelry represented 49% of Signet’s merchandise sales in fiscal 2026.
- 17.
Signet’s fourth quarter brought in $2.35 billion of its $6.81 billion in fiscal 2026 sales, or 34.4% of the year.
— Gustavo Athayde analysis of Signet Jewelers data
- 18.
Signet reported a positive performance for the 10 peak holiday selling days of the 2025 season.
- 19.
At Brilliant Earth, the fourth quarter of 2025 was its largest quarter ever, with $124.4 million in net sales, 28.4% of the year’s $437.5 million.
— Gustavo Athayde analysis of Brilliant Earth data
Holiday spending
- 20.
U.S. holiday retail sales from November 1 through December 31, 2025, grew 4.1%.
- 21.
Americans planned to spend $890.49 per person on the 2025 holidays, including $627.93 on gifts for family and friends.
- 22.
Jewelry sales rose about 2% in the 2025 holiday season (November 1–December 21), according to Mastercard SpendingPulse.
Valentine’s Day proposals and jewelry
Valentine’s Day closes the engagement season. It ranks among the top proposal dates of the year, and jewelry is now the largest single category of Valentine’s spending.
Proposals and spending
- 23.
Valentine’s Day appears among the top proposal dates of the year in The Knot’s 2026 study, and February brought 7% of engagements among couples marrying in 2025.
— The Knot 2026 Real Weddings Study, Zola First Look Report 2025
- 24.
Americans planned a record $29.1 billion in Valentine’s Day spending in 2026, according to a survey of 7,791 adults.
- 25.
Jewelry is the largest Valentine’s Day category by dollars: shoppers planned to spend $7 billion on it in 2026.
- 26.
That is up from $6.5 billion in 2025, and the share of shoppers planning to buy jewelry rose from 22% to 25%.
- 27.
Jewelry accounts for 24% of all planned Valentine’s Day spending in 2026, and its budget grew 7.7% in a year.
— Gustavo Athayde analysis of National Retail Federation, National Jeweler, reporting NRF data data
Jewelry and the romantic partner
- 28.
Shoppers budgeted a record $199.78 on average for Valentine’s Day gifts in 2026, up from $188.81 in 2025.
- 29.
55% of Americans planned to celebrate Valentine’s Day in 2026, and 83% of them planned a gift for a significant other.
- 30.
Gifts for romantic partners were expected to reach $14.5 billion in 2026.
- 31.
February, the month of Valentine’s Day, brought 7.7% of 2019 jewelry store sales, tied with August for fourth place behind December, May and November.
— Gustavo Athayde analysis of U.S. Census Bureau, Monthly Retail Trade Survey data
- 32.
On February 14, 1987, about 46,000 couples in the national marriage-registration area married, more than on any other day of that year (historical data).
Where Americans propose
Most proposals now happen outdoors, and a little over half are private. Travel has become a favored backdrop: more than one in five proposals in 2024 took place on vacation.
Settings
- 33.
72% of proposals take place outdoors (couples married in 2025).
- 34.
In 2025, over half of couples (53%) chose a private proposal setting.
- 35.
In the 2024 study, 39% of proposals took place in a public place.
- 36.
34% of proposals took place at a scenic spot, and for 17% of couples the location had a special meaning (2024).
- 37.
The most common settings in 2024 were a vacation in the U.S. (14%), an outdoor activity (14%), home (14%) and the beach (14%).
- 38.
11% of 2024 proposals happened at a public garden, park or zoo, 8% on vacation abroad, 7% in front of a famous landmark and 5% in a restaurant or bar.
Proposal locations at a glance
Setting, 2024 Share of proposals U.S. vacation 14% Outdoor activity 14% At home 14% Beach 14% Garden, park or zoo 11% Vacation abroad 8% Famous landmark 7% Restaurant or bar 5% Scenic spot (any setting) 34% Location with special meaning 17%
Source: The Knot 2024 Jewelry & Engagement Study. Categories are not mutually exclusive.
Travel and etiquette
- 39.
Adding domestic and foreign trips, 22% of 2024 proposals took place on vacation.
— Gustavo Athayde analysis of The Knot 2024 Jewelry & Engagement Study data
- 40.
Nearly 1 in 5 proposals now take place during travel or vacation, according to a 2026 survey of 2,000 U.S. adults engaged or married in the past five years.
- 41.
Asked in 2014, 70% of Americans said private proposals are better and 8% preferred a public one; 75% preferred a simple proposal to an elaborate one (7%) (historical data).
— YouGov
- 42.
Proposing at someone else’s wedding is a breach of etiquette for half of Americans: 50% call it unacceptable and 31% acceptable (2023, 7,670 adults).
— YouGov
What this means for travelers. A proposal abroad or on a family trip turns a place into part of the couple’s story. Some couples carry that place into a wax seal for their invitations, or into the wedding monogram itself.
How Americans propose
The classic gestures have endured: the ring in hand, the bended knee, the four words. What has changed is the planning. Most proposals are now prepared weeks in advance, and a growing share involve a hired professional.
Planning and surprise
- 43.
The majority (85%) of proposals are now intentional, planned events, and nearly 70% are planned more than a month in advance (2025).
- 44.
81% of proposals in 2025 were a surprise.
- 45.
In 2024, 83% of proposees considered the proposal a surprise, and only 13% said it was a spontaneous gesture.
- 46.
51% of proposers discussed proposal preferences with their partner beforehand (2025).
The gestures
- 47.
Nearly 9 in 10 proposers pop the question with a ring in hand (2025).
- 48.
In 2024, 89% of people proposed with a ring in hand and 85% got down on one knee.
- 49.
87% said the words “Will you marry me?” (2024).
- 50.
57% of couples said they cried during the proposal (2024).
- 51.
One in five proposers (20%) hired a secret photographer to capture the moment, and 5% included their pet (2024).
Photographers, planners and parties
- 52.
26% of proposers hired a vendor such as a photographer, florist or planner to help with the proposal (2025).
- 53.
58% of proposers feel some or a lot of pressure to plan a highly unique proposal (2023).
- 54.
The Knot projects an estimated $120 million increase in U.S. spending on proposal and engagement photographers and florists over two years (projection, 2025).
- 55.
Pre-set packages from The Yes Girls, a U.S. proposal-planning firm in business since 2008, cost $3,000 to $7,000; luxury proposals run from $20,000 to over $150,000 (company pricing, 2026).
- 56.
Engagement photography costs an average of about $250 to $406 nationally, and a proposal shoot can cost as much as double (2026).
- 57.
28% of couples hold an engagement party (2025).
Family blessing and tradition
About seven in ten proposers still ask for the family’s blessing, a share that has held steady for years. Tradition shapes the ring as well: nearly all couples consider it worth keeping, and some wear one handed down through the family.
Asking for the blessing
- 58.
Nearly 70% of proposers asked for the parents’ permission or blessing in 2024.
- 59.
In The Knot’s 2024 Jewelry & Engagement Study, 69% asked for parental permission.
- 60.
In 2022, 71% of couples sought parental permission before the proposal.
- 61.
63% of Americans say it is very or somewhat important to ask a parent’s blessing or permission before marrying someone (2020, 5,185 adults).
— YouGov
The ring as tradition
- 62.
98% of couples marrying in 2025 still believe the engagement ring is a valuable tradition.
- 63.
96% of couples exchanged rings to mark their engagement (2025).
- 64.
8% of engagement rings among couples marrying in 2025 were heirlooms passed down from a family member.
- 65.
4% of engagement rings were engraved with something personal (2025).
Who proposes
- 66.
8% of couples marrying in 2025 had a counterproposal, and another 8% wish they had.
- 67.
Only 2% of women in opposite-sex couples proposed to their partner, according to a Zola survey of more than 1,200 engaged couples (about 2022).
— Zola
- 68.
59% of couples marrying in 2025 said it should be more acceptable for a woman to propose to a man.
What this means for families. Asking a parent’s blessing is a small act that joins two families before the wedding does. Heirloom rings carry the same idea forward, as does a family crest or an engraved signet made to be passed down.
The engagement ring
The ring is still part of nearly every proposal, and most recipients now help choose it. For the full picture of prices and stones, see our engagement ring statistics.
Choosing the ring
- 69.
The average engagement ring cost $4,600 in 2025, down from $5,200 the year before.
— The Knot 2026 Real Weddings Study, Rapaport, reporting The Knot 2026 Real Weddings Study
- 70.
79% of ring recipients were involved in choosing the ring in 2025; only 21% of rings were chosen without their input.
- 71.
57% of proposers start their ring search more than six months in advance, and 63% make the final purchase within two months of the proposal (2025).
- 72.
One in four couples shop together at a retailer before the proposal (2025).
- 73.
88% of couples made custom edits to their ring or had it custom-designed (2025).
— The Knot 2026 Real Weddings Study, Rapaport, reporting The Knot 2026 Real Weddings Study
Keeping it safe
- 74.
41% of proposers hold onto the ring for more than a month before proposing, and 45% keep it somewhere unsecured (2026).
- 75.
Less than half of ring owners (49%) insure the ring at purchase (2026).
- 76.
62% count their engagement ring among the three most expensive things they own (2026).
- 77.
90% of wearers travel with their engagement ring (2026).
From first date to wedding day
Americans take their time. The typical couple dates for about three years before the proposal, then spends a little over a year engaged, and both partners are now about seven years older at their first marriage than in 1975.
Before the proposal
- 78.
Couples dated for an average of 3 years before getting engaged (10,474 couples married in 2025).
- 79.
70% of couples lived together before the engagement (2025).
- 80.
More than half of couples (57%) discussed engagement and marriage more than a year before the proposal (2024).
- 81.
68% of couples marrying in 2026 decided together when to get engaged, and 55% shopped for rings together.
- 82.
Nearly 1 in 5 couples (19%) enter full wedding-planning mode before they are technically engaged (2026).
The engagement
- 83.
The average engagement lasted 14 months in 2025, after holding at 15 months every year since 2022.
— The Knot
- 84.
Zola puts the average engagement at 18 months for couples marrying in 2026, and half of its 2025 couples were engaged for 12 to 18 months.
- 85.
Nearly 60% of couples begin wedding planning within a month of the proposal (2025).
- 86.
From first date to wedding day, the average couple spends about 4 years and 2 months: three years of dating and a 14-month engagement (couples married in 2025).
— Gustavo Athayde analysis of The Knot 2026 Real Weddings Study, The Knot data
- 87.
More than half (56%) of couples marrying in 2025 had been together at least five years by the wedding day; 42% had been together four years or less.
— Gustavo Athayde analysis of Zola First Look Report 2025 data
The road to the altar
Milestone Typical length Source Dating before engagement 3 years The Knot, 2025 Planning the proposal more than 1 month (nearly 70%) The Knot, 2025 Holding the ring before proposing more than 1 month (41%) Jewelers Mutual, 2026 Start of wedding planning within 1 month (nearly 60%) The Knot, 2025 Engagement 14 months (Zola: 18) The Knot, 2025; Zola, 2026 First date to wedding about 4 years 2 months Gustavo Athayde analysis
Sources: The Knot 2026 Real Weddings Study, Jewelers Mutual, The Knot, Zola First Look Report 2026.
Age and living together
- 88.
One-third of couples married in 2025 met online, the leading way partners connect for the fourth year in a row.
- 89.
The median age at first marriage reached 30.8 for men and 28.4 for women in 2025.
- 90.
Both medians are 7.3 years higher than in 1975, when they stood at 23.5 for men and 21.1 for women.
— Gustavo Athayde analysis of U.S. Census Bureau data
- 91.
Marriages of couples who moved in together before being engaged were 48% more likely to end: 34% had ended, versus 23% for those who waited until after engagement or marriage (first marriages from 2010–2019).
What this means for couples. The order of life’s steps still matters. The research from the Institute for Family Studies suggests that couples who settle the question of commitment before sharing a home tend to build more lasting marriages.
Marriage in America today
Marriages have recovered past their pre-pandemic level, and most young Americans who have never married still hope to. The proposal remains, for most, the first step toward a lasting commitment.
Marriages by the numbers
- 92.
The United States recorded 2,128,446 marriages in 2024, a rate of 6.3 per 1,000 people (provisional).
- 93.
That is 4.2% more than the 2,041,926 marriages of 2023, and 27% more than the pandemic low of 1,676,911 in 2020.
— Gustavo Athayde analysis of CDC/NCHS, National Vital Statistics System data
- 94.
Nevada has the highest marriage rate, with 24.8 marriages per 1,000 residents performed there in 2024, followed by Utah (13.4) and Hawaii (12.4).
Hopes for marriage
- 95.
69% of never-married adults aged 18 to 34 say they want to get married one day, and only 8% say they do not (2023).
- 96.
68% of unmarried young men aged 18 to 29 want to get married someday, with only 10% saying no (2025).
- 97.
Among those young men who want children, 90% also want marriage (2025).
- 98.
86% of unmarried adults aged 22 to 35 expect to marry someday, according to a 2025 survey of 5,275 young adults.
- 99.
39% of Americans say it is very important for a couple with a child together to marry, up 10 points from 2020 (2026).
— Gallup
- 100.
Fewer than half (47%) of U.S. households were married couples in 2025.
Methodology
Proposal timing, settings and customs come mainly from The Knot’s Real Weddings and Jewelry & Engagement studies (10,474 couples married in 2025; more than 7,800 couples in the 2024 Jewelry & Engagement Study) and from Zola’s First Look Reports. Zola’s monthly shares come from couples marrying in 2025, most of whom became engaged in 2023 or 2024. Figures are labeled by the year of the survey or of the wedding.
The Engagement Calendar Index divides each month’s share of proposals by its number of days and scales the result so that an average day equals 100. Monthly wedding shares come from the last national monthly marriage counts published by the National Center for Health Statistics (2007); jewelry store sales come from the Census Bureau’s Monthly Retail Trade Survey (NAICS 44831, not seasonally adjusted), which has published this store category through 2020. Company figures from Signet and Brilliant Earth come from their filings and results releases.
Survey figures from different studies are presented separately and are not combined, except in clearly labeled Gustavo Athayde analyses. Comparisons are descriptive, not causal. Projections and company pricing are labeled as such.
About the author

Gustavo Athayde — Founder & Creative Director, GUSTAVO ATHAYDE
Gustavo Athayde is the founder and creative director of GUSTAVO ATHAYDE, a bespoke monogram atelier based in Sioux Falls, South Dakota. A graphic designer by training, he creates monograms, personal and family crests, heraldic emblems, signet designs and wax seals for individuals, families, couples and brands across the United States. Every commission is refined line by line into a symbol meant to be kept, used and passed down.
Follow the atelier on Instagram · Request a private consultation
Frequently asked questions
- What is the most popular month to propose?
- December. It accounted for 13% of engagements among couples marrying in 2025, ahead of May and June at 11% each.
- What is the most popular day to get engaged?
- Christmas Day, followed by Christmas Eve, December 23 and New Year’s Eve. Valentine’s Day is also among the top dates of the year.
- What percentage of proposals happen during the holidays?
- About 40% of proposals take place between Thanksgiving and Valentine’s Day, according to The Knot’s 2026 Real Weddings Study.
- Do people still ask for permission to propose?
- Yes. Nearly 70% of proposers asked the parents’ permission or blessing in 2024, a share that has stayed close to seven in ten since at least 2022.
- Where do most proposals take place?
- Outdoors, in 72% of cases. Home, the beach, outdoor activities and U.S. vacations each accounted for 14% of 2024 proposals.
- How long do couples date before getting engaged?
- About three years on average, followed by an engagement of around 14 months, according to The Knot.
Cite this page
Source: Gustavo Athayde, "Proposal Statistics 2026", https://gustavoathayde.com/proposal-statistics/Feel free to use these statistics and charts — we just ask for a link back to this page.
Sources
- Families and living arrangements, press release CB25-TPS.78 (2025) (U.S. Census Bureau)
- Marriage rates by state, 1990, 1995 and 2000–2024 (CDC/NCHS)
- Monthly Retail Trade: estimates of monthly retail sales by kind of business, 1992–present (jewelry stores, NAICS 44831) (U.S. Census Bureau)
- Monthly Vital Statistics Report Vol. 38 No. 12 supplement: advance report of final marriage statistics, 1987 (NCHS)
- National Vital Statistics Reports Vol. 57 No. 11, provisional marriages by month, 2007 (NCHS)
- Provisional number of marriages and divorces and rates: United States, 2000–2024 (CDC/NCHS)
Wedding and couple studies
- 2025 Global Wedding Report press release (Business Wire, August 14, 2025) (The Knot Worldwide)
- 2025 wedding trends: First Look Report data deep dive (couples marrying in 2025) (Zola)
- 2026 Real Weddings Study data read-out (10,474 U.S. couples married in 2025) (The Knot)
- Addressing the stigma around women proposing to men (Zola)
- Average engagement length (2026) (The Knot)
- Data insights from weddings in 2022 (The Knot)
- Engagement ring survey release (October 13, 2026) (Jewelers Mutual)
- First Look Report 2025: wedding trends (Zola)
- First Look Report 2026 (11,500+ couples marrying in 2026) (Zola)
- How to protect your engagement ring at destination proposals (2026 Engagement Ring Study, via InsuranceNewsNet) (Jewelers Mutual)
- Real Weddings Study 2026 announcement (February 2026) (The Knot Worldwide)
- Real Weddings Study data: weddings in 2023 (The Knot)
- The “Swiftification” of weddings (Business Wire, September 16, 2025) (The Knot Worldwide)
- Wedding proposal myths, debunked (2024 Jewelry & Engagement Study) (The Knot)
- Weddings in 2024: Real Weddings Study data insights (The Knot)
Research centers and polls
- Americans more likely to say parents should marry (2026) (Gallup)
- Among young adults without children, men are more likely than women to say they want to be parents someday (February 15, 2024) (Pew Research Center)
- Daily question: asking a parent’s blessing before marrying (February 12, 2020) (YouGov)
- Daily question: proposing at another person’s wedding (August 31, 2023) (YouGov)
- Dating recession: Wheatley Institute survey report on marriage (February 12, 2026) (Deseret News)
- Most Americans prefer simple, private proposals (2014) (YouGov)
- New IFS survey: how young American men view marriage, fatherhood and purpose (2025) (Institute for Family Studies)
- What’s the Plan? Cohabitation, engagement and divorce (Stanley and Rhoades, 2023) (Institute for Family Studies)
Industry, company and trade press
- Annual report on Form 10-K for fiscal 2026 (filed March 19, 2026) (Signet Jewelers)
- CNBC/NRF Retail Monitor December data shows strong holiday season spending (January 2026) (National Retail Federation)
- Consumers to spend second-highest amount on record, holiday survey (October 16, 2025) (National Retail Federation)
- Engagement photography prices (cost guide, 2026) (Thumbtack)
- Fiscal 2026 fourth quarter earnings call transcript (Signet Jewelers)
- Fourth quarter and full year 2025 results (SEC Form 8-K, March 5, 2026) (Brilliant Earth)
- Fourth quarter and full year fiscal 2026 results (Business Wire, March 19, 2026) (Signet Jewelers)
- How much does a proposal planner cost? (2026) (The Yes Girls)
- Lab-grown taking over engagement ring spending: The Knot (2026) (Rapaport)
- Shoppers to spend big on jewelry this Valentine’s Day, says NRF (2026) (National Jeweler)
- U.S. holiday retail sales up 4%, Visa and Mastercard say (January 9, 2026) (National Jeweler)
- Valentine’s Day spending expected to reach new records (January 27, 2026) (National Retail Federation)
- Welcome to engagement season, when nearly 40% of marriage proposals happen (INSTORE)