
Multigenerational Households by State 2026: 100 Statistics on Families Under One Roof
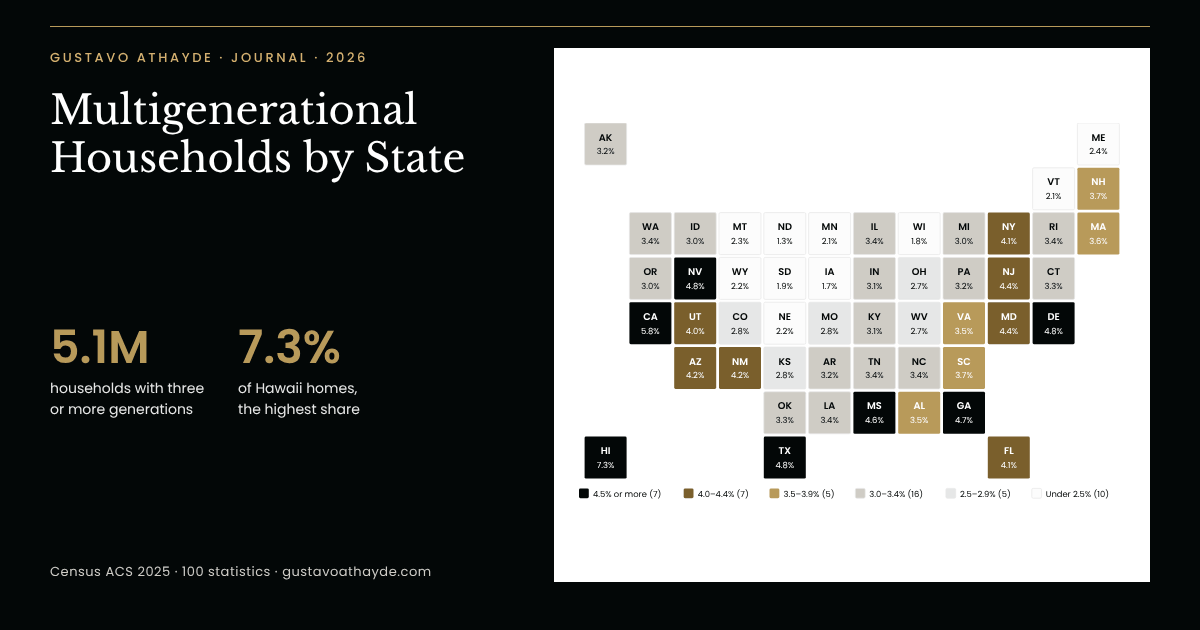
Three generations under one roof is more common than many assume. In 2025, 5.12 million American households, about 1 in 26, included a grandparent, a parent and a child, the most in a decade of Census data. Counting people instead of households, Pew Research Center finds that 22% of Americans live with more than one adult generation.
Below you will find our ranking of multigenerational households by state for all 50 states, with margins of error and the change since 2015, together with 100 statistics on grandparents, adult children, caregiving, housing and the family traditions of Thanksgiving.
At a glance
Key takeaways
- 5.12 million households (3.8%) had three or more generations in 2025, up 12.1% from 2015.
- Hawaii (7.3%) ranks first in our Under One Roof Index, followed by California (5.8%).
- Delaware, Nevada and Texas share third place at 4.8%; North Dakota (1.3%) ranks 50th.
- The national share has held steady for a decade: 3.9% in 2015, 3.8% in 2025.
- 22% of Americans live with more than one adult generation, up from 13% in 1970 (Pew).
- 81.4% of grandparent-headed homes with grandchildren also include a parent.
- 57% of adults in multigenerational homes call the experience positive; 17% call it negative.
- 91% of Americans celebrate Thanksgiving, and 65% say a blessing is said at their table.
Multigenerational households by state: the Under One Roof Index
The Census Bureau counts a household as multigenerational when it holds three or more generations of one family: a grandparent, a parent and a child, for example, under one roof. Our Under One Roof Index ranks the 50 states by the share of all households that fit that description in the American Community Survey for 2025, released this fall.
The ranking at a glance
SHARE THIS CHART
Copy the code below to embed this chart on your site:
Highlights of the ranking
- 1.
5.12 million American households were multigenerational in 2025, home to three or more generations of one family. That is 3.8% of all 134.1 million households, or about 1 in 26 (ACS 2025).
— U.S. Census Bureau; Gustavo Athayde analysis
- 2.
Hawaii (7.3%) ranks first in our Under One Roof Index. Its share of multigenerational households is 1.9 times the national rate, about 1 home in 14 (ACS 2025).
— U.S. Census Bureau; Gustavo Athayde analysis
- 3.
California (5.8%) ranks second, with 813 thousand multigenerational households, more than any other state and 15.9% of the national total (ACS 2025).
— U.S. Census Bureau; Gustavo Athayde analysis
- 4.
Delaware, Nevada and Texas (4.8% each) share third place. Georgia (4.7%) and Mississippi (4.6%) are statistically tied with them (ACS 2025).
— U.S. Census Bureau; Gustavo Athayde analysis
- 5.
40.4% of the nation’s multigenerational households are in four states: California, Texas, Florida and New York (ACS 2025).
— U.S. Census Bureau; Gustavo Athayde analysis
The map: South, West and the Pacific
Regions and the end of the ranking
- 6.
14 states have a multigenerational share above the national rate of 3.8%; every one of them is in the South or the West except New Jersey and New York (ACS 2025).
— U.S. Census Bureau; Gustavo Athayde analysis
- 7.
The West (4.7%) has the highest share of multigenerational households of the four Census regions, followed by the South (4.0%), the Northeast (3.7%) and the Midwest (2.7%) (ACS 2025).
— U.S. Census Bureau; Gustavo Athayde analysis
- 8.
5.5 times: a Hawaii household is that much more likely to be multigenerational than a North Dakota household (ACS 2025).
— U.S. Census Bureau; Gustavo Athayde analysis
- 9.
North Dakota (1.3%) ranks 50th, statistically tied with Iowa (1.7%). Wisconsin (1.8%) and South Dakota (1.9%) follow (ACS 2025).
— U.S. Census Bureau; Gustavo Athayde analysis
- 10.
1.5% of households in Washington, D.C., are multigenerational; the District is shown in our table but not ranked. In Puerto Rico the share is 3.5% (ACS 2025).
— U.S. Census Bureau; Gustavo Athayde analysis
Under One Roof Index, states 1–17
Rank State Share 2025 MOE Households Share 2015 Change (pts) 1 Hawaii 7.3% ±0.6 36,655 7.7% −0.4 2 California 5.8% ±0.1 812,734 5.9% −0.0 3 Delaware 4.8% ±0.8 20,270 3.9% +0.9 3 Nevada 4.8% ±0.3 60,392 4.2% +0.7 * 3 Texas 4.8% ±0.2 553,659 5.1% −0.3 * 6 Georgia 4.7% ±0.2 199,643 4.4% +0.2 7 Mississippi 4.6% ±0.4 54,618 5.2% −0.6 * 8 Maryland 4.4% ±0.3 106,599 5.0% −0.6 * 8 New Jersey 4.4% ±0.2 157,759 4.4% −0.0 10 Arizona 4.2% ±0.3 127,858 4.2% −0.0 10 New Mexico 4.2% ±0.4 36,386 3.8% +0.4 12 Florida 4.1% ±0.2 383,518 4.0% +0.1 12 New York 4.1% ±0.1 319,487 4.3% −0.2 * 14 Utah 4.0% ±0.3 48,505 4.5% −0.5 * 15 New Hampshire 3.7% ±0.5 21,502 2.6% +1.1 * 15 South Carolina 3.7% ±0.2 84,051 3.7% −0.0 17 Massachusetts 3.6% ±0.2 101,719 3.5% +0.1
Under One Roof Index, states 18–34
Rank State Share 2025 MOE Households Share 2015 Change (pts) 18 Alabama 3.5% ±0.2 71,777 3.5% −0.1 18 Virginia 3.5% ±0.2 122,652 3.8% −0.3 * 20 Illinois 3.4% ±0.2 175,854 3.6% −0.2 20 Louisiana 3.4% ±0.3 62,386 3.7% −0.3 20 North Carolina 3.4% ±0.2 153,712 3.3% +0.1 20 Rhode Island 3.4% ±0.6 15,107 3.4% −0.1 20 Tennessee 3.4% ±0.2 99,936 3.5% −0.2 20 Washington 3.4% ±0.2 107,542 3.0% +0.4 * 26 Connecticut 3.3% ±0.3 48,062 2.9% +0.4 * 26 Oklahoma 3.3% ±0.2 53,195 3.2% +0.1 28 Alaska 3.2% ±0.5 8,939 4.0% −0.7 * 28 Arkansas 3.2% ±0.3 41,178 3.1% +0.1 28 Pennsylvania 3.2% ±0.2 170,446 3.3% −0.1 31 Indiana 3.1% ±0.2 87,227 2.9% +0.2 31 Kentucky 3.1% ±0.3 59,350 3.1% +0.0 33 Idaho 3.0% ±0.3 22,882 2.8% +0.2 33 Michigan 3.0% ±0.2 123,877 2.9% +0.1
Under One Roof Index, states 35–50
Rank State Share 2025 MOE Households Share 2015 Change (pts) 33 Oregon 3.0% ±0.3 52,405 2.7% +0.3 36 Colorado 2.8% ±0.2 69,167 3.1% −0.3 36 Kansas 2.8% ±0.3 34,086 2.5% +0.3 36 Missouri 2.8% ±0.2 72,100 2.8% −0.1 39 Ohio 2.7% ±0.1 134,460 2.9% −0.2 39 West Virginia 2.7% ±0.4 20,095 3.2% −0.5 * 41 Maine 2.4% ±0.3 14,599 2.2% +0.2 42 Montana 2.3% ±0.4 11,089 1.6% +0.7 * 43 Nebraska 2.2% ±0.3 18,494 2.0% +0.2 43 Wyoming 2.2% ±0.7 5,757 2.1% +0.2 45 Minnesota 2.1% ±0.1 49,924 2.1% 0.0 45 Vermont 2.1% ±0.5 6,107 1.9% +0.2 47 South Dakota 1.9% ±0.4 7,450 2.0% −0.1 48 Wisconsin 1.8% ±0.1 45,585 2.0% −0.2 * 49 Iowa 1.7% ±0.2 23,478 1.9% −0.2 50 North Dakota 1.3% ±0.4 4,712 1.5% −0.1 — District of Columbia 1.5% ±0.4 5,078 3.7% −2.1 * — United States 3.8% ±0.04 5,124,063 3.9% −0.05
Share of all households that are multigenerational (three or more generations), ACS 2025 and 2015 1-year estimates, Table B11017. MOE = 90% margin of error of the 2025 share. Ranks are shared when the rounded shares match; states whose shares differ by less than the combined margin are statistically tied. * = change statistically significant at the 90% level. Source: U.S. Census Bureau; Gustavo Athayde analysis.
Reading the ranking
What this means
A high rank is not a verdict on any state. In Hawaii, California and much of the South and Southwest, three generations under one roof reflect long family traditions as much as the cost of housing. In the Upper Midwest, young adults tend to set up their own households early and grandparents often live nearby rather than in the same home. Families who share a roof often look for a symbol that belongs to everyone in it; our guide to the luxury family crest explains how one is drawn.
A decade of change, 2015–2025, and the 2020 Census
The number of multigenerational households has grown for a decade, while their share of all households has held remarkably steady. The 2020 Census, which counts every household rather than a sample, puts the figures higher.
- 11.
12.1% more multigenerational households existed in 2025 than in 2015: 5.12 million, up from 4.57 million (ACS 2015 and 2025).
— U.S. Census Bureau; U.S. Census Bureau; Gustavo Athayde analysis
- 12.
3.9% in 2015 and 3.8% in 2025: the national share of multigenerational households has held steady for a decade, a statistically insignificant change, because the number of all households grew at a similar pace (13.4%) (ACS).
— U.S. Census Bureau; U.S. Census Bureau; Gustavo Athayde analysis
- 13.
5.12 million multigenerational households in 2025 is the highest count in every year of the 2015–2025 American Community Survey series, up 5.5% since 2021 (ACS).
— U.S. Census Bureau; U.S. Census Bureau; Gustavo Athayde analysis
- 14.
Hawaii has led the country in both 2015 (7.7%) and 2025 (7.3%); California ranked second in both years (ACS).
— U.S. Census Bureau; U.S. Census Bureau; Gustavo Athayde analysis
- 15.
New Hampshire (+1.1 points) posted the largest statistically significant rise in its multigenerational share from 2015 to 2025, to 3.7% from 2.6% (ACS).
— U.S. Census Bureau; U.S. Census Bureau; Gustavo Athayde analysis
The states that changed
- 16.
5 states saw a statistically significant increase in their multigenerational share between 2015 and 2025: New Hampshire, Montana (+0.7), Nevada (+0.7), Connecticut (+0.4) and Washington (+0.4 points) (ACS).
— U.S. Census Bureau; U.S. Census Bureau; Gustavo Athayde analysis
- 17.
9 states saw a statistically significant decline over the same decade, led by Alaska (−0.7 points), Mississippi (−0.6) and Maryland (−0.6); the other 36 states were statistically unchanged. The share in Washington, D.C., also fell significantly, to 1.5% from 3.7% (ACS 2015–2025).
— U.S. Census Bureau; U.S. Census Bureau; Gustavo Athayde analysis
- 18.
65% more multigenerational households lived in Montana in 2025 than in 2015, the fastest growth in the count of any state, ahead of New Hampshire (57%) and Delaware (48%) (ACS).
— U.S. Census Bureau; U.S. Census Bureau; Gustavo Athayde analysis
- 19.
86 thousand multigenerational households were added in Florida from 2015 to 2025, a 29% rise and the largest gain in number of any state (ACS).
— U.S. Census Bureau; U.S. Census Bureau; Gustavo Athayde analysis
What the 2020 Census found
- 20.
6.0 million multigenerational households were counted in the 2020 Census, 4.7% of all households, up from 5.1 million in 2010.
- 21.
7.2% of family households were multigenerational in the 2020 Census, an increase from 2010.
- 22.
9.1% of Hawaii households were multigenerational in the 2020 Census, the highest of any state; California had 7.3% and Texas 6.0% (USAFacts analysis of Census data).
— USAFacts
- 23.
0.5% to 31.0%: the range of the multigenerational share of family households across U.S. counties in the 2020 Census.
- 24.
24% of households in Oglala Lakota County, South Dakota, had three or more generations in 2020, the highest share of any county; five of the 10 leading counties are in South Dakota (USAFacts, 2020 Census).
— USAFacts
Multigenerational living statistics: how many Americans share a home
Counting people rather than households gives a larger number. Pew Research Center counts everyone who lives with more than one adult generation, which includes adult children living with their parents. By that measure, more than one American in five lives in a multigenerational home.
- 25.
22% of Americans lived in a household with more than one adult generation in 2024, up from 13% in 1970 (Pew Research Center analysis of Census data).
- 26.
21% of Americans lived in multigenerational homes in 1950, before the share fell to a low of 12% in 1980, in Pew’s 2018 series (Pew Research Center; historical).
- 27.
59.7 million Americans lived with multiple generations under one roof in March 2021, a number that quadrupled from 1971 (Pew Research Center; latest published count).
- 28.
31% of adults ages 25 to 29 lived in a multigenerational household in 2021, far more than adults in their 30s (Pew Research Center).
- 29.
10% of Americans in multigenerational households lived in poverty in 2020, compared with 12% of those in other types of households (Pew Research Center).
What national surveys add
- 30.
33% of U.S. adults lived in a household with at least two generations of adults in 2025 (Federal Reserve Survey of Household Economics and Decisionmaking).
- 31.
19% of adults lived with an adult child in 2025, and 15% lived with a parent; 2% did both at once (Federal Reserve).
- 32.
26% of American adults said they lived in a household of three or more generations in a 2021 Generations United and Harris Poll survey (2,051 adults; self-reported, historical).
Why families choose to live together
Finances matter, but they are not the whole story. Many families live together to care for one another, and most say the arrangement works.
- 33.
A third of adults in multigenerational households cite caregiving as a major reason for the arrangement, including 25% who care for an adult and 12% who help with child care (Pew Research Center, 2021).
- 34.
28% of adults in multigenerational homes say it is simply the arrangement they have always had (Pew Research Center, 2021).
- 35.
57% of adults living in multigenerational homes describe the experience as positive, against 17% who call it negative (Pew Research Center, 2021).
- 36.
58% say their multigenerational arrangement is convenient all or most of the time, and 54% call it rewarding (Pew Research Center, 2021).
How families feel about it
- 37.
63% of parents who live with an adult child say they pay more than half the rent or mortgage (Pew Research Center, 2021).
- 38.
79% of Americans in multigenerational households said in 2021 that the arrangement had strengthened bonds among family members (Generations United and Harris Poll; historical).
- 39.
72% of those in multigenerational households planned in 2021 to keep living that way for the long term (Generations United and Harris Poll; historical).
- 40.
28% of prospective home buyers planned in 2025 to buy a home that will include family members from several generations, rising to 36% among Generation X (Veterans United survey of 900 buyers).
What this means
For most families, sharing a home is a choice made for one another, to care for a parent, to help a son or daughter get started or to keep a household together. Setting clear expectations about money, space and privacy at the start is what most families who do it well recommend.
Grandparents and grandchildren under one roof
Grandparents are the keystone of the multigenerational home. In most households where they live with grandchildren, a parent is present too.
- 41.
4.84 million households, 3.6% of all households, include a grandparent living with his or her own grandchildren under 18 (ACS 2025, Table B10063).
— U.S. Census Bureau; Gustavo Athayde analysis
- 42.
6.66 million grandparents live with their own grandchildren under 18, and 2.00 million of them (30%) are responsible for those grandchildren’s basic needs (ACS 2025, Table B10050).
— U.S. Census Bureau; Gustavo Athayde analysis
- 43.
51% of grandparents responsible for coresident grandchildren have carried that responsibility for five years or more (ACS 2025).
— U.S. Census Bureau; Gustavo Athayde analysis
- 44.
Hawaii (6.7%) has the highest share of households with grandparents living with grandchildren, followed by Mississippi (5.2%) and California (5.0%) (ACS 2025).
— U.S. Census Bureau; Gustavo Athayde analysis
- 45.
67% of grandparents who live with grandchildren in North Dakota are responsible for them, and 64% in South Dakota, the highest shares in the country, though both estimates carry wide margins of error; nationally the figure is 30% (ACS 2025).
— U.S. Census Bureau; Gustavo Athayde analysis
- 46.
0.94 is the correlation across the 50 states between the share of multigenerational households and the share of households with grandparents living with grandchildren: the same states lead on both measures (ACS 2025).
— U.S. Census Bureau; U.S. Census Bureau; Gustavo Athayde analysis
Grandparents nationally
- 47.
81.4% of households headed by a grandparent with coresident grandchildren also included at least one of the grandchildren’s parents in 2021, three generations under one roof (Census Bureau).
- 48.
60.1% of grandparents living with grandchildren were 60 or older in 2021, up from 46.8% in 2012 (Census Bureau).
- 49.
3.3% of Americans 30 and older lived with grandchildren under 18 in 2021, almost exactly the 3.4% of 1970 (Census Bureau).
- 50.
6.1 million children, 8.4% of all children under 18, lived in their grandparents’ home in the 2020 Census, up from 5.8 million in 2010.
The grandparent contribution
- 51.
About 65 million Americans are grandparents, and 11% of them currently live with a grandchild (AARP survey of 3,283 grandparents, late 2025).
— AARP
- 52.
69% of grandparents provide some care for their grandchildren, an average of 510.9 hours a year (AARP, 2026).
— AARP
- 53.
$903 billion a year is AARP’s estimate of what grandparents contribute: $172 billion in direct financial support and $731 billion in unpaid care of grandchildren (2026).
— AARP
- 54.
28% of parents with children under 13 relied on the children’s grandparents for child care in 2025 (Federal Reserve).
What this means
Grandparents give families time, money and memory. A family seal or a monogram that joins the initials of three generations is one way to mark that continuity; our guide to custom coats of arms shows how families combine their names.
Young adults living with parents
Adult children at home are the most common form of shared living today. Most of them work, and many contribute to the household.
- 55.
33.6% of adults ages 18 to 34 living in households, 24.8 million people, live in a home headed by a parent as the householder’s child (ACS 2025, Table B09021).
— U.S. Census Bureau; Gustavo Athayde analysis
- 56.
New Jersey (45.8%) has the highest share of 18- to 34-year-olds living as the child of the householder, followed by Connecticut (43.3%) and California (40.4%) (ACS 2025).
— U.S. Census Bureau; Gustavo Athayde analysis
- 57.
North Dakota (11.5%) has the lowest share, followed by Wyoming (18.3%) and South Dakota (19.2%) (ACS 2025).
— U.S. Census Bureau; Gustavo Athayde analysis
- 58.
5.1% of adults ages 35 to 64, 6.4 million people, live in a household headed by a parent; in Hawaii the share is 8.8% (ACS 2025).
— U.S. Census Bureau; Gustavo Athayde analysis
Young adults nationally
- 59.
58% of adults ages 18 to 24 lived in their parental home in 2025, compared with 16% of those ages 25 to 34 (Census Bureau, Current Population Survey).
- 60.
A record 25.2 million adults under 35 lived with their parents in 2025, 33.0% of the age group, just below the 2020 peak of 33.6% (Realtor.com analysis of Census data).
- 61.
49% of adults under 30 lived with a parent in 2025, up 12 percentage points since 2019 (Federal Reserve).
- 62.
28% of single adults ages 25 to 34 live with their parents, compared with 6% of married young adults (NAHB analysis of ACS 2024).
- 63.
45% of Americans ages 25 to 34 in 1975 had moved out, were working, had married and had children; by 2024, less than a quarter had reached all four milestones (Census Bureau).
- 64.
77% of parents of 18- to 34-year-olds rate their relationship with their young adult children as excellent or very good (Pew Research Center, 2023).
Aging parents and family caregiving
At the other end of the family, more Americans care for an aging parent, and many older Americans share a home with relatives.
- 65.
14.4% of Americans 65 and older in households, 9.1 million people, share a home with relatives other than a spouse or partner, either in a relative’s household or heading a household that includes relatives such as adult children (ACS 2025, Table B09021).
— U.S. Census Bureau; Gustavo Athayde analysis
- 66.
California (21.4%) and Hawaii (21.1%) have the highest shares of older adults living with relatives other than a spouse or partner; North Dakota has the lowest (5.7%) (ACS 2025).
— U.S. Census Bureau; Gustavo Athayde analysis
- 67.
26.5% of Americans 65 and older in households live alone (ACS 2025).
— U.S. Census Bureau; Gustavo Athayde analysis
- 68.
34.2% of all U.S. households include at least one person 65 or older; Hawaii leads at 43.9% (ACS 2025, Table B11007).
— U.S. Census Bureau; Gustavo Athayde analysis
Family caregivers
- 69.
63 million Americans, nearly 1 in 4 adults, provided ongoing care to a family member or friend in 2025, an increase of 20 million since 2015 (AARP and National Alliance for Caregiving).
- 70.
Nearly 1 in 4 family caregivers provide 40 or more hours of care a week, and 6 in 10 also hold a job (AARP, 2025).
- 71.
38.2 million people provided unpaid care to someone 65 or older in 2023–2024, and almost half of them (47%) cared for a parent (Bureau of Labor Statistics; a narrower measure than AARP’s).
- 72.
25% of U.S. adults were in the “sandwich generation” in 2025: they have a parent 65 or older and are raising a child under 18 or financially supporting an adult child. That includes 54% of Americans in their 40s (Pew Research Center).
- 73.
75% of adults 50 and older want to stay in their current home for as long as possible, and 73% in their community (AARP, 2024).
— AARP
- 74.
1 in 4 older homeowners would consider building an accessory dwelling unit, the kind of separate suite often added for a parent or an adult child (AARP, 2024).
— AARP
Multigenerational homes and the housing market
Builders and buyers have noticed. Homes with a second primary suite, a separate entrance or an accessory dwelling unit now form a distinct part of the market.
- 75.
2.49 people live in the average American household; Utah (2.88), Hawaii (2.78) and California (2.77) have the largest households (ACS 2025, Table B25010).
— U.S. Census Bureau; Gustavo Athayde analysis
- 76.
9.2% of U.S. households have five or more members; in Utah the share is 17.3%, the highest in the nation (ACS 2025, Table B11016).
— U.S. Census Bureau; Gustavo Athayde analysis
- 77.
3.4% of occupied homes have more than one occupant per room, the Census measure of crowding; Hawaii (8.6%) and California (7.8%) have the highest shares (ACS 2025, Table B25014).
— U.S. Census Bureau; Gustavo Athayde analysis
- 78.
4.1% vs. 3.1%: in the 10 states with the highest median home values, an average of 4.1% of households are multigenerational, against 3.1% in the 10 states with the lowest values (ACS 2025; correlation 0.57).
— U.S. Census Bureau; U.S. Census Bureau; Gustavo Athayde analysis
Multigenerational home buyers
- 79.
14% of home buyers purchased a multigenerational home between July 2024 and June 2025, down from 17% the year before (National Association of Realtors).
- 80.
41% of buyers of multigenerational homes did so to take care of aging parents; 29% cited cost savings and 27% adult children moving back home (NAR, 2025).
- 81.
3.9 million owner-occupied homes housed three or more generations in 2024, up from 3.2 million in 2014, or 4.5% of all owner-occupied households (Realtor.com analysis of ACS data).
- 82.
12.1% of owner-occupied households in Urban Honolulu are multigenerational, the highest share among the 100 largest metro areas (Realtor.com, 2024).
- 83.
$709,000 was the median list price of homes marketed for multigenerational living in 2025, about 65% above the $429,900 median for a standard listing (Realtor.com).
- 84.
40 is now the median age of first-time home buyers, an all-time high, and first-time buyers made up a record-low 21% of purchases (NAR, 2025).
What this means
A multigenerational home is often bought by two generations together and lived in by three. Families who mark such a house, on a gate, a door knocker or a set of linens, often choose a monogram that unites more than one surname, as our guide to the luxury couple monogram describes.
The cost of care that families share
The price of care outside the family helps explain why so many families provide it at home.
- 85.
$74,400 a year, or $6,200 a month, was the national median cost of assisted living in 2025, up 5% (CareScout Cost of Care Survey).
— Genworth
- 86.
$129,575 a year is the median cost of a private nursing home room ($355 a day) in 2025 (CareScout).
— Genworth
- 87.
$80,080 a year is the cost of a non-medical home caregiver at the 2025 median of $35 an hour, assuming 44 hours a week (CareScout).
— Genworth
- 88.
$13,184 was the national average annual price of child care in 2025, 10% of the median income of a two-parent household (Child Care Aware of America).
- 89.
5.6 times: a year of assisted living ($74,400) costs 5.6 times as much as a year of child care ($13,184) at 2025 national averages, and a private nursing home room ($129,575) costs 9.8 times as much.
— Genworth; Child Care Aware of America; Gustavo Athayde analysis
- 90.
$58,800 a year is the median cost of assisted living in South Dakota, home of our atelier, against $145,155 in Hawaii, the highest of any state (CareScout, 2025).
- 91.
$414,400 was the median price of an existing home sold in 2025, a record (National Association of Realtors via the Associated Press).
- 92.
22.6 million renter households, half of all renters, spent more than 30% of income on housing in 2023, a record (Harvard Joint Center for Housing Studies).
Annual cost of care, 2025
Type of care Median annual cost Source Nursing home, private room $129,575 CareScout Home health aide (non-medical, 44 hours a week) $80,080 CareScout Assisted living $74,400 CareScout Adult day health care $24,700 CareScout Child care (national average price) $13,184 Child Care Aware of America
A year of assisted living costs about 5.6 times a year of child care (Gustavo Athayde calculation). Sources: CareScout Cost of Care Survey 2025; Child Care Aware of America, 2025.
Thanksgiving and the traditions that bring families home
Thanksgiving is the one day of the year when many American households become multigenerational for an afternoon. The holiday remains among the most widely shared traditions in the country.
- 93.
91% of Americans celebrate Thanksgiving (Pew Research Center survey of 9,609 adults, 2024).
- 94.
65% of U.S. adults say someone at their Thanksgiving dinner typically says a prayer or blessing (Pew Research Center, 2024).
- 95.
26% of Americans expected to share Thanksgiving dinner with more than 10 other people in 2024, and 34% planned to have dinner at their own home (Pew Research Center).
- 96.
75% of Americans said their 2025 Thanksgiving would include at least one family member (YouGov, 1,120 adults).
— YouGov
- 97.
81.8 million Americans were projected to travel at least 50 miles from home over Thanksgiving 2025, a record, 73 million of them by car (AAA forecast).
— INRIX
Family as a value
- 98.
$55.18 was the cost of a classic Thanksgiving dinner for 10 in 2025, about $5.52 per person and 5% less than in 2024 (American Farm Bureau Federation).
- 99.
49% of Americans name family as one of their three most important personal values, more than any other value (Gallup, 2025).
— Gallup
- 100.
49% of Americans rank the cost of raising a family among the top three issues facing families, up from 33% in 2023 (American Family Survey, 3,000 adults, 2025).
What this means
Gatherings like Thanksgiving are where family stories are told and heirlooms are passed down. A monogrammed tablecloth, a set of napkins or a seal on the place cards can carry a family’s name to the table for many years; our guide to bespoke monograms explains the craft.
Methodology
Our Under One Roof Index ranks the 50 states by the share of all households that are multigenerational in the American Community Survey 2025 1-year estimates (Table B11017). The Census Bureau defines a multigenerational household as one with three or more generations, such as a householder, the householder’s children and grandchildren, or a householder with a parent and a child. Margins of error are the Census Bureau’s 90% margins, carried to each share with the Bureau’s formula for proportions; states whose shares differ by less than the square root of the sum of their squared margins are described as statistically tied.
The change since 2015 compares the 2015 and 2025 1-year estimates for the same table; changes larger than the combined margin are called statistically significant. No standard 1-year estimates were released for 2020. The 2020 Census, a full count, found a higher share (4.7%) than the ACS; the two sources use different methods and are not combined.
Pew Research Center and the Federal Reserve measure people, not households, and include homes with two adult generations, so their percentages are larger. Supplementary ACS tables cover grandparents (B10063, B10050), living arrangements of adults (B09021), older adults (B11007) and housing (B25010, B25014, B25077, B11016). Correlations and comparisons between states are descriptive, not causal.
About the author

Gustavo Athayde — Founder & Creative Director, GUSTAVO ATHAYDE
Gustavo Athayde is the founder and creative director of GUSTAVO ATHAYDE, a bespoke monogram atelier based in Sioux Falls, South Dakota. A graphic designer by training, he creates monograms, personal and family crests, heraldic emblems, signet designs and wax seals for individuals, families, couples and brands across the United States. Every commission is refined line by line into a symbol meant to be kept, used and passed down.
Follow the atelier on Instagram · Request a private consultation
Frequently asked questions
- Which state has the most multigenerational households?
- Hawaii has the highest share: 7.3% of its households held three or more generations in 2025. California has the largest number, about 813,000 households.
- How many multigenerational households are there in the U.S.?
- About 5.12 million in 2025, or 3.8% of all households, according to the American Community Survey. The 2020 Census counted 6.0 million (4.7%).
- Which state has the fewest multigenerational households?
- North Dakota ranks 50th at 1.3%, statistically tied with Iowa (1.7%). Wisconsin and South Dakota follow.
- What counts as a multigenerational household?
- For the Census Bureau, a home with three or more generations of one family. Pew Research Center uses a broader definition, two or more adult generations, which is why it reports 22% of Americans.
- Why do families live in multigenerational homes?
- Caregiving, cost savings and adult children moving home are the most common reasons. Among buyers of multigenerational homes in 2025, 41% cited caring for aging parents.
- Are multigenerational households increasing?
- In number, yes: up 12.1% from 2015 to 2025. As a share of all households the rate has held near 3.8% because the total number of households grew at a similar pace.
Cite this page
Source: Gustavo Athayde, "Multigenerational Households by State 2026", https://gustavoathayde.com/multigenerational-households-by-state/Feel free to use these statistics and charts — we just ask for a link back to this page.
Sources
- Average household size, Table B25010, ACS 2025 (U.S. Census Bureau)
- Economic Well-Being of U.S. Households in 2025: living arrangements, care and work (Federal Reserve Board)
- Families and living arrangements: 2025 (U.S. Census Bureau)
- Grandparents and their coresident grandchildren: 2021 (U.S. Census Bureau)
- Grandparents living with own grandchildren, Table B10050, ACS 2025 (U.S. Census Bureau)
- Household type by household size, Table B11016, ACS 2025 (U.S. Census Bureau)
- Households by presence of people 65 and over, Table B11007, ACS 2025 (U.S. Census Bureau)
- Households with grandparents living with grandchildren, Table B10063, ACS 2025 (U.S. Census Bureau)
- How common are multigenerational households? (USAFacts)
- Living arrangements of adults by age, Table B09021, ACS 2025 (U.S. Census Bureau)
- Median home value, Table B25077, ACS 2025 (U.S. Census Bureau)
- Milestones to adulthood (U.S. Census Bureau)
- Multigenerational households, Table B11017, ACS 2015 1-year (U.S. Census Bureau)
- Multigenerational households, Table B11017, ACS 2025 1-year (U.S. Census Bureau)
- Several generations under one roof (U.S. Census Bureau)
- Tenure by occupants per room, Table B25014, ACS 2025 (U.S. Census Bureau)
- Unpaid eldercare in the United States, 2023–2024 (U.S. Bureau of Labor Statistics)
Research and surveys
- 2024 Home and Community Preferences Survey (AARP)
- A record 64 million Americans live in multigenerational households (Pew Research Center)
- Caregiving in the US 2025 (AARP and National Alliance for Caregiving)
- Demographics of multigenerational households (Pew Research Center)
- Family is the top value for Americans (Gallup)
- Financial issues top the list of reasons U.S. adults live in multigenerational homes (Pew Research Center)
- Grandparents and their essential role (AARP)
- Grandparents report 2026 (AARP)
- More than half of Americans in their 40s are sandwiched (Pew Research Center)
- Most Americans celebrate Thanksgiving, but traditions vary (Pew Research Center)
- Multigenerational living fact sheet, Family Matters (2021) (Generations United)
- Multigenerational living is on the rise, Family Matters report (2021) (Generations United)
- Nearly 3 in 10 prospective homebuyers prioritize multigenerational living (Veterans United)
- Parents, young adult children and the transition to adulthood (report) (Pew Research Center)
- Population in multigenerational households, 1970–2024 (The United States at 250) (Pew Research Center)
- Thanksgiving 2025: what Americans will cook, eat and debate (YouGov)
- Top issues facing families, American Family Survey 2025 (BYU Wheatley Institute and Deseret News)
Industry, associations and news
- 2025 home sales stuck at 30-year low (Associated Press) (PBS NewsHour)
- 2025 Profile of Home Buyers and Sellers (National Association of Realtors)
- CareScout Cost of Care Survey 2025 (Genworth)
- Child care prices rival major household expenses (Child Care Aware of America)
- Cost of Thanksgiving dinner declines (American Farm Bureau Federation)
- Nearly 4 million American homes now house multiple generations (Realtor.com release) (Realtor.com via StockTitan)
- Nearly 82 million Americans projected to travel over Thanksgiving (AAA forecast) (INRIX)
- Ranked median costs by state, 2025 (CareScout)
- The empty nest is on hold: 1 in 3 adults under 35 lives with parents (Realtor.com release) (Realtor.com)
- The State of the Nation's Housing 2025 (Harvard Joint Center for Housing Studies)
- Who lives with parents? (NAHB Eye on Housing)